
Indian Economy
3.1.IndianEconomy and its characteristics
The Indian economy is seen to have maintained its growth momentum in the second quarter of Financial Year 2023-24 (Q2 FY24) and is estimated to have grown about 7% with robust factory expansion and higher consumption.
3.1.1The Key determinants
- India’s GDP grew by 7.8% in the first quarter of the 2023-2024 fiscal year.
- The growth estimates for the second quarter can touch the 7% mark because of the factors such as e-way bills, Goods and Services Tax (GST) collections, credit growth, electricity consumption, and other mobility indicators suggest that healthy private consumption and factory output, robust services activity, and front-loading of government capital expenditure (Official estimates will be released by the end of November 2023).
- The central government has spent around 49% of its FY24 budgeted capex in the first half of the year, which is 43% higher than the expenditure in the same period in 2022.
3.1.2 Contributor factors of Robust Growth
-
- Geopolitical Factors:
- In global geopolitics, positive signs have emerged from West Asia, where Israel and Hamas are reported to have agreed to a short ceasefire. Which has since been effected since 24th November 2023 but it couldn’t continue for long.
- Another positive development has been US and Chinese President holding a summit and discussing various global and bilateral issues including the West Asia situation, Iran, Taiwan, climate change and military communication.
- Despite there being no joint statement or formal cooperation declaration, the summit still managed to send a positive and important signal that cooperation can bring benefits to a nervous world.
- 3.1.3 Economical Factors:
- External:
- Inflation Easing: A positive surprise has come from the recent inflation prints in the developed world.
- The US Consumer Price Index (CPI) based inflation stood at 3.2% in October, down from 3.7% in September.
- Alongside, inflation in the European Union also dropped sharply to 2.9% from 4.3% the month before.
- Bond Yield Easing: Bond yields have eased globally and equities have soared as these price readings have raised hopes that the fight against inflation may have finally reached an end.
- Inflation Easing: A positive surprise has come from the recent inflation prints in the developed world.
- Internal:
- Decline in Inflation: Retail inflation eased by 10 basis points to 4.9% — a four-month low.
- Core inflation eased to 4.2%.
- The Wholesale Price Index declined 0.52% compared to the same period in 2022, marking the seventh consecutive month in negative territory, imparting relief to producers via softer input prices.
- Stability in Crude Oil Prices: Global crude oil prices have continued to soften and are seemingly staring at a bear market. The West Texas Intermediate is down around 20% from a high in September.
- Festivals: The festive season also ended on a positive note. According to the Confederation of All India Traders (CAIT), retail markets in India saw record trading of Rs 3.75 lakh crore during this festive season.
- Decline in Inflation: Retail inflation eased by 10 basis points to 4.9% — a four-month low.
- External:
- Geopolitical Factors:
- Add to this an additional trade of Rs 50,000 crore during the remaining festivals and the signals are encouraging.
3.1.4 Challenges:
- Oil Prices: Oil prices need to be carefully watched with the Organization of the Petroleum Exporting Countries (OPEC) and its allies (OPEC+) leaders set to review production targets later this month. The grouping will want to defend the prices going forward and they could do that by leveraging their pricing power and making sure that the supply deficit is maintained via extension of supply cuts. Following steps can help India reduce its dependence on the OPEC+.
- Diversify the Sources of Oil Imports: India has increased the number of its crude oil suppliers from 27 countries in 2006-07 to 39 in 2021-22, adding new suppliers like Columbia, Libya, Gabon, Equatorial Guinea etc., while strengthening its relationship with countries like US and Russia.
- Accelerate Bio-fuel Economy: India has been developing its bio-fuel economy by increasing the ethanol blending in petrol from 1.53% in 2013-14 to 20% by 2025-26.
- The government has also launched the National Green Hydrogen Mission to develop green hydrogen production capacity of at least 5 MMT per annum.
- Shift to Renewable Energy Sources: India has been promoting the use of natural gas and renewable energy sources to reduce its oil consumption and carbon footprint.
- The government has set a target of increasing the share of natural gas in the energy mix from 6% to 15% by 2030.
- The government has also announced its aim of achieving 500 GW installed capacity from non-fossil fuel based sources by 2030.
- External Demand: The external demand environment still remains very feeble and world trade growth remains at historic lows, with few signs of improvement. In fact, it is projected to decline from 5% in 2022 to 1% in 2023.
- Boost Domestic Demand: The government has announced a series of measures to boost the investment climate, such as easing the Foreign Direct Investment (FDI) norms, reducing the corporate tax rate, and launching a production-linked incentive scheme for various sectors.
- These initiatives can help attract more domestic and foreign investment and create more jobs and income opportunities for the people.
- Enhance Export Competitiveness: India can boost export competitiveness through improved quality, increased productivity, diversified export markets, and streamlined trade facilitation. The government has taken steps to improve the ease of doing business, simplify the GST regime, implement the National Logistics Policy, and reform the labour laws.
- These measures can help reduce the regulatory and logistical barriers for exporters and make them more efficient and competitive in the global market.
- Pursue Regional and Bilateral Trade Agreements: India can pursue regional and bilateral trade agreements with its strategic partners and potential markets, which can help expand its market access, reduce tariff and non-tariff barriers, and promote trade and investment flows.
- The government has expressed its interest in joining the Comprehensive and Progressive Agreement for Trans-Pacific Partnership (CPTPP), which is a mega-regional trade pact among 11 countries.
- India is also negotiating free trade agreements with the European Union, the UK, Australia, and the Gulf Cooperation Council.
- These agreements can help India diversify its trade relations and benefit from the regional value chains.
- Boost Domestic Demand: The government has announced a series of measures to boost the investment climate, such as easing the Foreign Direct Investment (FDI) norms, reducing the corporate tax rate, and launching a production-linked incentive scheme for various sectors.
- Monetary and Fiscal Polices: India should align its monetary and fiscal policies, considering both local and global influences. Experts praise India for effectively coordinating these policies, unlike the US and elsewhere.
- The Reserve Bank of India (RBI) and the finance ministry have adeptly handled global risks and ongoing inflation concerns.
- The government is progressing towards its 5.9% GDP fiscal deficit target and should emphasize its commitment to this goal.
Concludingly, we can say India’s Q2 FY23-24 macroeconomic outlook is optimistic, projecting a 7% GDP growth. Factors include geopolitical stability, favorable economic conditions, and controlled inflation with stable oil prices. Challenges like fluctuating oil prices require strategic measures, such as diversifying sources and prioritizing green initiatives. Domestically, sustaining demand and boosting export competitiveness are key focuses. India demonstrates commitment to global economic stability through effective policy coordination, including monetary and fiscal measures.
But in the recent past our economy has faced the covid -19 pandemic alongwith the whole world and their impact on the economy has affected tremendously. In the following paras we have analysed the effects of Covid -19 on the Indian Economy.
3.2.STEPS NEEDED TO BUILD A RESILIENT ECONOMY
- Spendings: Increased spending on Health, Education and Infrastructure and cut on spending on wasteful subsidies,thus restructuring India’s Public Finance.
- Investments: Increase in Capital Expenditure with emphasis on durable assets and Decrease in Revenue Expenditure.
National Infrastructure Pipeline aims to invest Rs 111 lakh crore by 2025 in a range of projects spanning across sectors to boost the infrastructure sector.
- Human Capital: To become an Alternative Global Manufacture and Economic Powerhouse, India needs to focus upon its Human Capital, huge internal Consumer Demand and clinical implementation of policy prescriptions.
- Employment Generation: Need to reduce the existing disguised unemployment in Agriculture and shift the extra workforce towards Manufacturing and Services by creating opportunities for them.
- Reforms: Second Generation Land reform by fixing Land Titling, and acquisition issues.
Thus, through these measures Economic Complexity can be changed into Economic prosperity.
3.3 IMPACT OF COVID-19 ON INDIAN ECONOMY
- At –23.9% contraction for the first quarter of 2020-21, India’s growth showed one of the highest contractions globally.
- Projections: Various projections for India’s Growth were –
o The 2020-21 real GDP growth for India is forecast in the range of (-) 5.8% (RBI) to (-) 14.8% (Goldman Sachs).
- In response the Government announced Rs 20 Lakh Crore Atma Nirbhar Bharat COVID-19 Economic stimulus package. The salient features of the package include:
o A stimulus to MSMEs through a Rs 3 Lakh Crore ($40bn) loan scheme.
O Helping other stressed business sectors such as NBFCs, power distribution companies and the real estate sector.
O Provisioning of free food grains to migrant workers for the next two months
o Provisioning of a Rs 1 Lakh Crore ($13bn) subsidy to agricultural cooperative societies
o Hiking the allocation for the MGNREGS by Rs 40,000 cr ($5.3bn)
- The combined (Centre + State) fiscal deficit amounts to 13.8% of GDP.
- Reversal of Economic Progress: Economic contraction is not merely a GDP number for economists to analyse and debate. It means a reversal of many years of progress.
- Employment Scenario: Around 27% to 30% of the households had no income during the lockdown. Urban households (43%) reported more loss of income compared to their rural counterparts (24% ).
This is the present scenario of Indian Economy, but to reach at this stage from the beginning was a Herculean task for the policy makers , when they got the ruined economy after Independence. To understand the present economy we have to know how our economy grew from the beginning. The journey of the economy has been summarized in the annexed fingertip series given at the end of the chapter.
3.4 What is Planning
- A plan spells out how the resources of a nation should be put to use. It should have some general goals as well as specific objectives which are to be achieved within a specified period of time;
- In India plans are of five years duration and are called five year plans (we borrowed this from the former Soviet Union).
- Our plan documents specify the objectives to be attained in the five years of a plan and what is to be achieved over a period of twenty years (called as perspective plan)
- Five year plans of India do not spell out how much of each and every good and service is to be produced.
In 1950, the Planning Commission was set up with the
Prime Minister as its Chairperson and the era of five year plans had begun.
3.5 Evolution of Planning in India
3.5.1 A.PRE-INDEPENDENCE PLANNING IN INDIA
- i) M. Visvesvaraya published his book “Planned economy in India” in 1934. In this book he presented a constructive draft of the development of India in 10 years. His core idea was to lay out a plan to shift labour from agriculture to industries and double up National income in ten years. This was the first concrete scholarly work towards planning.
The economic perspective of India’s freedom movement was formulated during the Karachi session of INC (1931), Faizpur session of INC 1936
- ii) National Planning Committee (1938) – was the
first attempt to develop a national plan for India. This committee was set up by Congress president Subhash Chandra Bose and was chaired by Jawaharlal Nehru. However the reports of the committee could not be prepared and only for the first time in 1948-49 some papers came out.
- iii) Bombay Plan – In 1944, Industrialists of Bombay including Mr. JRD Tata, GD Birla, Purshottamdas Thakurdas, Lala Shriram, Kasturbhai Lalbhai, AD Shroff, Ardeshir Dalal, & John Mathai working together prepared “A Brief Memorandum Outlining a Plan of Economic Development for India” which was popularly known as Bombay Plan. This plan envisaged doubling the per capita income in 15 years and tripling the national income during this period.
- Iv) In August 1944, The British Indian government set up a “Planning and Development Department” under the charge of Ardeshir Dalal. But this department was abolished in 1946.
- v) People’s Plan – Plan was based upon Marxist socialism and drafted by M N Roy. This plan was for a ten years period and gave greatest priority to Agriculture. Nationalization of all agriculture and production was the main feature of this plan.
- vi) • Gandhian Plan (1944) – Put forward by Sri Shriman Narayan in 1944 who was principal of Wardha Commercial College. It was a modest kind of plan. Plan emphasized economic decentralization with primacy to rural development by developing cottage industries
- vii) Sarvodaya Plan (1950) – Plan was drafted by Jaiprakash Narayan inspired by Gandhian plan as well as Sarvodaya Idea of Vinoba Bhave. It emphasized on small and cotton industries and agriculture as well. Plan also stressed upon land reforms and decentralized participatory planning.
3.5.2 B. POST-INDEPENDENCE
- i) Economic Programme Committee (EPC) – formed by All India Congress Committee (AICC) with Nehru as its chairman. The aim of this committee was to make a plan which could balance private and public partnership and urban and rural economies. The EPC recommended in 1948 to form a permanent Planning Commission in India.
In March 1950 in pursuance of declared objectives of the Government, the Planning Commission was set up by a Resolution, with Jawaharlal Nehru as the first Chairman of the Planning Commission.
The Planning Commission was charged with the responsibility of making assessment of all resources of the country, augmenting deficient resources, formulating plans for the most effective and balanced utilization of resources and determining priorities.
3.6 Achievements of Planning
- India became one of the largest and emerging economies in Asia with about 2.7 trillion USD GDP. and 3.7 Trillion US$ in 2023.
- India has become the fifth-largest economy in 2019, overtaking the United Kingdom and France.
- Improvement in social indicators – IMR, MMR, Literacy among others.
- Global leadership of India in the service sector.
- Considerable expansion of the higher and vocational education sector – Health universities, engineering institutions etc.
-
- Poverty dropped to about 20% of the population
- Increase in National Income and Per Capita Income: During the planning period national income has increased manifold.
- A review of different plans shows that the first five year plan was a success as it achieved a growth rate of 3.6 per cent against a target of 2.1 percent growth rate in national income. (Present Scenario: As per the National Statistical Office (NSO), the annual per capita (net national income) at current prices is estimated at Rs 1,72,000 in 2022-23, up from Rs 86,647 in 2014-15.)
- Development in Agriculture: Agricultural productivity has also marked an upward trend during the plan period.
- The production of food-grains which was 510 lakh tonnes in 1950-51 increased to 176.4 million tonnes in 1990-91 and further to 211.9 million tonnes in 2001-02 and 332 million tonnes in 2023.
- ● Development of Industry: In the first five-year plans much of the capital was invested to develop the industry and defence. About fifty per cent of the total outlay of the plans was invested for their development. As a result, industrial
- production has increased to a great extent.
- ● Development of Transport and Communication: In the first two plans, more than one-fourth of the total outlay was invested on the development of transport and communication.
- ● Self-Reliance: During the last five decades, considerable progress seems to have been made towards the achievement of self-reliance. We are no longer dependent on other countries for the supply of food-grains and a number of
- agricultural crops.
- ● Employment Generation: Schemes such as Mahatma Gandhi National Rural Employment Guarantee Act (MGNREGA) and Aajeevika – National Rural Livelihoods Mission (NRLM) were launched under the Planning Commission which covers almost 20% of the country’s total population.
- ● Price Stability: With the exception of war torn years and 1991 crisis, core inflation had never breached the double digit mark.
- ● Capital Formation: In India due to the development of agriculture, industry and defence, the rate of capital formationhas also increased i.e., from 20% in 1980 to 34% in 2014 (World Bank).
- ● Social Justice: The planning in India has an objective of sustained growth with social justice. As a result, these plans have been ensuring the improvement of living standards of the people, removal of poverty, creation of additional jobs, and reduction in inequalities of income and wealth.
- ● Development of Science and Technology: In the era of planning, India has made much progress in the field of science and technology. India ranked 40th out of 132 in the Global Innovation Index (GII) 2022 rankings released by World Intellectual Property Organization (WIPO).
- ● Social and Miscellaneous Services: It consists of such vital services as education, health and family planning, housing, labour welfare and welfare of backward classes etc. and a considerable amount has been allotted in our five year plans for the provision of these services.
3.7 FAILURES AND SHORTCOMINGS OF INDIAN PLANNING
- ● Rise in Prices: While the Price Level came down in the first plan, they recorded a steep rise in almost all other plans.
- ● Increase in Unemployment: During the period of five-year plans, unemployment went on rising. At the end of the first five-year plan 53 lakh persons were unemployed.
- ● Neglect of Agriculture: The five-year plans failed to pay attention to the agricultural sector except for the first five-year plan and can be seen in the
- form of –
- i)Low productivity as compared to other developing nations.
- ii) Lack of consolidation of land holding.
- iii)Lopsided Green Revolution, which was region centric and few cereals centric.
- iv)Almost no financial support for farm mechanization in its policies.
- ● Slow Growth in Production Sector: Capital intensive industries in urban
- areas were given precedence over small scale industries in the rural areas. In agriculture, the green revolution continues to be confined largely to wheat and rice crops.
Inequality in Distribution of Income and Wealth: One of the main objectives of five-year plans has been to minimize inequality in distribution of income and wealth. But the plan witnessed only an increase in inequality. This inequality is found not only in the industrial sector but in the agriculture sector also.
- Widespread Poverty: Failure to address the problem of unemployment has resulted in widespread poverty in the country.
According to the survey conducted in 2011- 12 (Planning Commission), the percentage of persons below the poverty line in India for the year 2011-12 has been figured out as 25.7% in rural areas, 13.7% in urban areas and 21.9% for the country as a whole. The first four plans failed to address the problem of poverty.
- Lack of increase in the Standard of Living vis-à-vis other developed countries: All the five-year plans of India aimed at raising the standard of living of the people and even the basic necessities have not yet been provided to the people.
-
- On an average, a normal healthy person needs 2500-2700 calories per day (for men) but in India per capita availability of food is 2200-2400 calorie
- 3.8 THE NEW ECONOMIC POLICY OF 1991
-
- India faced its worst economic crisis in 1991. This crisis led India to adopt The New Economic Policy. This policy aimed
- to move India towards a higher economic growth rate. Also, it proposed to convert the Indian economy into a market
- economy, free of restrictions. The thrust of the policy was to create a more competitive environment in the economy
- and remove the barriers to entry and growth of firms.
- These reforms can broadly be classified into two groups:
-
- 1. Stabilisation Measures: These are short term measures, to correct the weaknesses developed in the balance of
- payments and to bring inflation under control.
- 2. Structural Reform Policies: There are long-term measures, improving the efficiency of the economy and increasing
- its international competitiveness
- These reforms came to be known as LPG Reforms because India from now onwards followed the policy of
- Liberalisation, Privatisation, and Globalisation (LPG). These can be defined as follows
- 3.8.1 LIBERALISATION:
- Liberalisation is the process or means of the minimizing/elimination of control of the state over economic activities. It
- provides a greater autonomy to the business enterprises in decision-making and eliminates government interference.
- Liberalisation is achieved through
| Deregulation
of Industrial Sector: |
Industrial licensing was abolished for almost all but a few product categories remain such as —
alcohol, cigarettes, hazardous chemicals, industrial explosives, electronics, aerospace and drugs and pharmaceuticals. ● Only Public sector industries reserved were related to defence equipment, atomic energy generation and railway transport. ● The market was allowed to determine the prices of goods. |
| Financial
Sector Reforms: |
Aim: To reduce the role of RBI from “regulator to facilitator” of the financial sector.
● The reform policies led to the establishment of private sector banks, Indian as well as foreign. ● Foreign investment limit in banks was raised to around 50 percent and Foreign Institutional Investors (FII) such as merchant bankers, mutual funds and pension funds, are now allowed to invest in Indian financial markets. |
| Foreign
Exchange Reforms: |
Before 1991, the Indian rupee was overvalued in terms of US $ and other important currencies.
This overvaluation of the Indian rupee discouraged our exports and encouraged imports. ● To correct this distortion the devaluation of Rupee in 1991 was made |
| Trade and
Investment Policy Reforms: |
Aim: To promote the efficiency of local industries, adoption of modern technologies and to increase international competitiveness of Indian Industrial production.
● Quantitative restrictions on imports were decreased in order to protect domestic industries. ● Tariff rates were reduced. ● Removal of licensing procedures for imports |
| Tax Reforms | Tax reforms concerned with government’s taxation and public expenditure policies, which are collectively known as its fiscal policy.
● Since 1991, there has been continuous reduction in the taxes on individual incomes as it was felt that high rates of income tax were an important reason for tax evasion. ● The rate of corporation tax, which was very high earlier, has been gradually reduced to just 15%. ● Tax procedures and laws were also simplified. |
- 3.8.2 PRIVATIZATION:
-
- Privatization has a very broad meaning in economics. Everything that ranges from the introduction of private capital to selling government-owned assets to transitioning to a private economy is included under Privatization.
- ● This was done in two ways:
- 1. Withdrawal of the government from ownership and management of public sector companies
- 2. Outright sale of public sector companies
- Special status to the PSUs has been granted as Maharatnas, Nauratnas and Miniratnas to improve the efficiency
- of PSUs by giving them autonomy in taking managerial decisions.
- 3.8.3 GLOBALIZATION:
-
- ● Globalization means the integration of the economy of the country with the world economy.
- ● It is the outcome of the set of various policies that are aimed at transforming the world towards greater interdependence and integration.
- ● Creation of networks and activities that will transcend economic, social and geographical boundaries.
- ● Outsourcing: In outsourcing a company hires regular service from external sources, mostly from other countries, which was previously provided internally or from within the country like legal advice, computer service, advertisement. Multinational corporations, and even small companies, are outsourcing their services to India where they can be with a reasonable degree of skill and availability of cheaper cost of labour.
- POSITIVE OUTCOMES OF THE LPG REFORMS:
- ● Increase in India’s GDP Growth Rate: During 1990-91, India’s GDP growth rate was only 1.1% but after LPG reforms of 1991, GDP growth rate increased year by year and in 2015-16 it was estimated to be 7.5% by the IMF.
- ● Foreign Investment Destination: Since 1991, India has firmly established itself as a lucrative foreign investment destination and FDI equity inflows in India in 2019-20 (till August) stood at US$ 19.33 billion.
- Decrease in Unemployment Rate: In 1991, the unemployment rate was high. However, LPG reforms of 1991 led to the arrival of new foreign companies and more jobs were generated thus leading to decrease in unemployment rate.
- Per Capita Income: The Per Capita Income increased due to an increase in employment.
ISSUES RELATED TO LPG REFORMS:
- Decrease in Agriculture GVA: In 1991, agriculture provided employment to 72% of the population and contributed 29.02 percent of the GDP. Now, the share of agriculture in the GDP has gone down drastically to 18%. This has resulted in decrease in per capita income of the farmers and increase in the rural indebtedness.
- MNC vs Local Business: Due to opening up of the Indian economy to foreign competition, more MNCs started competing with local businesses. This led to highly unequal business competition.
- Environmental Impacts: Globalization has also contributed to the destruction of the environment through pollution by emissions from manufacturing plants and clearing of vegetation cover.
- Widening Income Gaps: LPG reforms of 1991 have led to widening income gaps within the country. The higher growth rate was achieved at the cost of declining incomes of the majority of people, thus leading to increase in inequality
3.9 NITI Aayog vs Planning Commission
National Institution for Transforming India (NITI) Aayog, was formed via a resolution of the Union Cabinet on 1 January 2015.
- The Governing Council of NITI Aayog is chaired by the Prime Minister and comprises Chief Ministers of all the States and Union Territories with legislatures and Lt Governors of other Union Territories.
- NITI Aayog acts as the quintessential platform of the Government of India to bring the States to act together in national interest, and thereby fosters cooperative federalism.
3.9.1What is Planning Commission?
The Planning Commission of India is no longer active as the NITI Aayog replaced it in 2015. It was formulated on 15th March 1950, right after the enactment of the constitution of India. The Planning Commission used to form five-year plans at the national level and had the power to impose policies in states (which is not the case with the NITI Aayog).
Some significant functions of the Planning Commission are as follows:
- Effective planning was done to utilize the country’s resources efficiently.
- Evaluate the human and material resources, including technical personnel, and look for the possibilities of enhancing these resources for the betterment of the nation.
- Prepare a plan including the stages of implementation and allocation of resources for each stage.
3.9.2 What is NITI Aayog?
The NITI Aayog is the policy think tank for the Government of India, established on 01 January 2015 by the Central Government of India under the leadership of Prime Minister Narendra Modi.
- Some of the initiatives it took include a “15-year Road map” and a “7- year vision, strategy, and action plan”.
- It works as an advisory body and has no power to impose policies on states.
3.9.3 KEY FUNCTIONS OF NITI AAYOG
- Vision of National Development: To evolve a shared vision of national development, priorities sectors and strategies with the active involvement of States in the light of national objectives.
- Foster Cooperative and Competitive Federalism: Through structured support initiatives and mechanisms with the States on a continuous basis, recognizing that strong States make a strong nation.
- Planning: To develop mechanisms to formulate credible plans at the village level and aggregate these progressively at higher levels of government.
- Economic Strategy and Policy: To ensure, in areas that are specifically referred to, that the interests of national security are incorporated in economic strategy and policy.
- Work on Marginalised Society: To pay special attention to the sections of our society that may be at risk of not benefiting adequately from economic progress.
- Policy Framework Developments: To design strategic and long-term policy and programme frameworks and initiatives, and monitor their progress and their efficacy.
- Advisory Functions: To provide advice and encourage partnerships between key stakeholders and national and international like-minded Think tanks, as well as educational and policy research institutions.
- Collaborative Community: To create a knowledge, innovation and entrepreneurial support system through a collaborative community of national and international experts, practitioners and other partners.
- Settle Disputes and Differences: To offer a platform for resolution of inter-sectoral and inter departmental issues in order to accelerate the implementation of the development agenda.
- Modernisation and Evolution: To maintain a state-of-the-art Resource Centre, be a repository of research on good governance and best practices in sustainable and equitable development as well as help their dissemination to stakeholders
- Monitoring and Evaluation: To actively monitor and evaluate the implementation of programmes and initiatives, including the identification of the needed resources so as to strengthen the probability of success and scope of delivery
- Capacity Building: To focus on technology upgradation and capacity building for implementation of programmes and initiatives
3.10 Difference between NITI Aayog and Planning Commission
| Parameter | NITI Aayog | Planning Commission |
| Function | NITI Aayog has not been given the mandate or powers to impose policies on States. NITI Aayog is basically a think-tank or an advisory body. | The Planning Commission had the power to impose policies on States and for the projects approved by the Planning Commission. |
| Allocation of Funds | The powers for allocation of funds have not been given to the NITI Aayog. The powers are with the Finance Ministry. | The Planning Commission had the power to allocate funds to the State Governments and
various Central Government Ministries for various programmes and projects at National and State Levels. |
| Role of State Governments | In NITI Aayog, State Governments have to play a more proactive role.
In NITI Aayog, the final policy would bear fruit after due consultations are held with State Governments in the policy formulation stage. |
State Governments did not have much role to play apart from taking part in the meetings.
The State Government’s role was confined to the National Development Council. The Planning Commission first formulated policies, and then State Governments were consulted regarding the allocation of funds for the programmes or projects. |
| Governing Council | The Governing Council of NITI Aayog has Lieutenant Governors of Union Territories and State Chief Ministers.
The Governing Council of NITI Aayog has Lieutenant Governors of Union Territories and State Chief Ministers. |
The National Development Council had Lieutenant Governors and State Chief Ministers. Planning Commission had to report to the National Development Commission.
The National Development Council had Lieutenant Governors and State Chief Ministers. Planning Commission had to report to the National Development Commission |
| Constitutional Backing | NITI Aayog is an Executive Body as it is not mentioned in the Constitution of India, and it was not established by an Act of Parliament. | The now-defunct Planning Commission was also an Executive Body. |
| Powers to make policies | NITI Aayog has not been given the mandate or powers to impose policies on States. NITI Aayog is basically a think-tank or an advisory body. | The Planning Commission had the power to impose policies on States and for the projects approved by the Planning Commission. |
| Powers to allocate funds | The powers for the allocation of funds have not been given to the NITI Aayog. The powers are with the Finance Ministry. | The Planning Commission had the power to allocate funds to the State Governments and various Central Government Ministries for various programmes and projects at the National and State Levels. |
| Part-Time Members | Based on the requirements, there are part-time members appointed in NITI Aayog. | The Planning Commission did not have any provisions for the appointment of part-time members. |
| Appoinments | The CEO of NITI Aayog is appointed by the Prime Minister. Secretaries are known as CE | Planning Commission secretaries were appointed through the usual process. |
| Full Time Members | The number of full-time members in NITI Aayog could be lesser than the numbers that the Planning Commission had. | The last Planning Commission had eight full-time members |
| Organisational Structure | Under the NITI Aayog organisation structure, new posts were created – CEO, Vice-Chairperson. CEO has the rank of a Secretary. Four Cabinet members would serve as ex-officio members. NITI Aayog has two-part time members and five full-time members | The Planning Commission’s organisational structure consisted of full-time members, a member secretary and a Deputy Chairperson. |
3.10.1 CRITICISMS OF NITI AAYOG
- Limited Role or Influence in Policy Making: It has no role in influencing public or private investment. It does not seem to have influence in policy making with long-term consequences. For instance, demonetisation and the Goods and Services Tax.
- Not Evolved as per Recent Needs: NITI Aayog has still not evolved and its role remains unclear. An organization bestrode with too many powers but no accountability and answerability.
- Non-Critical Body: If it is a think-tank, it has to maintain a respectable intellectual distance from the Government of the day. Instead, we see uncritical praise of the Government-sponsored schemes/programmes.
- Limited Answerability: It is not able to answer specific questions like, why 90% are working in the unorganized sector? And moreover, as on date, more and more in formalisation is taking place in the organised sector.
- Untouched Areas: Labour force participation rate of women is also declining, when neighbours like Bangladesh are registering an increase.
Way Forward:
- Dedicated Time Period: Decentralization of planning should be done, but within a five-year plan framework.
- Administrative Lacunae: Bureaucratic inertia needs to be shaken, specializing it and fixing the accountability on the basis of performance.
- Should be an Opinion-Based Body: NITI Aayog should act as a force for persuasion, not control centre. Its role should be to promote local systems solutions to national problems.
- Diversification and Women Inclusion: All stakeholders including women must be involved in the implementation of a plan in a large, diversified and democratic country. Thus, planning should be devolved to State governments, and even to the third tier of city and district governance.
- Transformational Approach Needed: It requires new methods to speed up ‘organisational learning’ amongst stakeholders in the system who must make plans together and implement them together. Thus, it is not good enough to have a plan, there must also be a strategy for its cooperative implementation.
3.10.2 Conclusion
NITI Aayog could emerge as an agent of change over time and contribute to the government’s agenda of improving governance and implementing innovative measures for better delivery of public services as the Aayog continues to be representative of an efficient, transparent, innovative and accountable governance system in the country with distinguished work ethics thus paving the way for India becoming Vishwa Guru (World Leader).
3.11 Economic Reforms in India
(Part 1)
In response to the internal economic crisis of 1990-91 and the changing international situation,the Narasimha Rao government decided to introduce economic reforms or the New Economic Policy (NEP). The NEP clearly reflected certain global trends, namely, the collapse of the socialist economy and growing acceptance of economic globalization across the world.
Although the reforms as a part of the process of liberalization and globalization were revolutionary in nature, these were launched within the democratic framework of the country. They marked a shift from the Nehruvian consensus of the 1950s to a new consensus around reforms. While the national goals set out at Independence remained unaltered, the change came only in the strategy to achieve these goals – from Nehru-Mahalanobis development strategy to the new development strategy of liberalization and economic reforms.
Liberalisation, Privatisation and Globalisation were the tree main basis for economic reforms prior to Modi Government.
3.11.1.Economic Reforms of 1991 brought in LGP Reforms in India.
- Liberalization entails the removal of governmental limitations on private individual activity.
- Privatization refers to the transition of a business, industry, or service from public to private ownership and management.
- Globalization is the flow of products, services, capital, and labor across international borders.
3.11.2.Background of Economic Reform in India
- In order to lessen the burdens of the control regime (the licensing Raj), the Rajiv Gandhi administration (1984–1999) undertook a number of reforms in the latter part of the 1980s.
- These included loosening license requirements, lowering import restrictions, implementing export incentives, etc. However, these modifications were minor rather than fundamental, more about easing restrictions and operating them more flexibly than a thorough withdrawal of the control system.
- However, it pushed India’s GDP growth in the 1980s to over 5.5 percent, breaking the previous record of 5 percent growth known as the “Hindu rate of Growth” that had stood for the preceding three decades.
- While the Indian economy appeared to be performing well in the 1980s, there were long-term structural vulnerabilities developing in the system as a result of widespread industrial control through the license raj, Monopolies and Restrictive Trade Practices Act (MRTP) of 1969, nationalization of banks and other industries, self-sufficiency and an inward-looking trade strategy, as well as Import Substitution Industrialization (ISI).
- Due to the fact that imports were nearly two times as high as exports, there was a massive trade deficit in the second half of the 1980s (export earnings were only 55 percent of imports). All of this prompted India to borrow money in the short term more and more by the late 1980s.
- Up until the early 1980s, the government had wisely managed the fiscal (revenue and expenditure) situation, but it started to engage in fiscal profligacy (recklessly wasting money) by taking on large amounts of debt to support various development programs and maintain growth, which caused issues in the late 1980s and early 1990s.
- As a result, the macroeconomic foundations of the economy turned bad (fiscal deficit of 8.4%, current account deficit of 3.14%, high inflation of 17%, huge foreign debt, etc. in 1990–1991); this puts a lot of pressure on the Balance of Payment (BoP) front.
The worrying foreign exchange position was partly caused by the Iraqi invasion of Kuwait in August 1990, which increased oil prices (and the cost of imports) and decreased Indian exports to the Middle East or Gulf region. India’s sovereign rating (international credit rating) was severely lowered, making it very challenging to obtain credit (loan) abroad.
The three primary areas in which economic changes were implemented during the Economic Reforms of 1991 were as follows:
- We removed the complex system of rules, permissions, and licenses.
- In nearly every area of economic activity, we turned around the significant bias in favor of state ownership of the means of production and the expansion of public sector businesses.
- We stopped pursuing an inward-looking trade strategy.
The main goal of the reforms was to quickly and thoroughly integrate the Indian economy with the global economy through trade, investment, and technology flows. To this end, it was necessary to create conditions that would provide Indian entrepreneurs with a business environment that was roughly comparable to that of other developing nations.
3.11.3.Major Reforms Carried Out in 1991
Economic Reforms in India in 1991 carried out several changes. A few important reforms are-
Fiscal Stabilisation
The effectiveness of economic reforms depends on the achievement of fiscal stabilization. In order for the reforms to succeed, the Central Government’s fiscal deficit, which had reached 8.4% in the 1990–1991 fiscal year, needed to be reduced. The below actions were performed in order to decrease the budget deficit.
- Export subsidies were abolished in 1991–1992, and fertilizer subsidies were partially restructured in 1992–1993.
- Budget assistance to loss-making public-sector units in the form of government loans to cover their losses was gradually phased out.
- Some development expenditure, such as spending on social and economic infrastructure, was reformed.
Industrial Policy
Industrial policy has seen the most radical changes as a result of the reform plan. There is no longer a need for the government to grant approval for new investments or for the significant expansion of current capacity as it was previously under industrial licensing (License Raj).
- Nowadays, only a small number of businesses are required to have licenses, mostly due to environmental and pollution concerns. Additionally, the MRTP Act was also eliminated.
- The list of industries that were solely for the public sector to operate was drastically reduced, and many crucial sectors were made available to the private sector, including power generation, hydrocarbons (oil and gas exploration, production, and refining), air transportation, telecommunications, and others.
De-licensing of items reserved for the MSME Sector
Since 1991, the Ministry of Commerce and Industry has been gradually de-licensing the products specified for the MSME sector through a proactive approach.
Foreign Investment
Prior to 1991, India had an extremely restrictive and often regarded hostile foreign investment policy.
The new strategy supported foreign investment considerably more actively in a variety of ways. For foreign equity investments of up to 51 percent in a lengthy list of 34 industries, permission is automatically granted; for investments of more than 51 percent, government approval was required.
Trade and Exchange Rate Policy
With certain required exceptions, all raw materials, other production inputs, and capital products can now be imported without restriction.
Prior to 1991, the RBI-determined an official exchange rate on which the Indian Rupee was converted into foreign currency. The value of the rupee dropped by nearly 24 percent in July 1991. (for alignment of the exchange rate with the market rate). In 1993, India switched to a market-based exchange rate system (managed float/floating rate).
Tax Reforms
- In June 1991, the highest marginal rate of personal income tax was 56%. This was decreased to 40%.
- For publicly listed enterprises, corporate income tax was lowered from 51.75% to 46%.
- The average amount of customs duty drastically decreased from 200% to only 65%.
Public Sector Reforms
The government started a restricted process of disinvesting its ownership and equity in public sector enterprises instead of going through full privatization, keeping 51% of the equity and management control.
Financial Sector Reforms
- New private banks were allowed to compete in the banking sector, and numerous new banking licenses were granted.
- Trading practices in capital markets are kept under transparent and strict control. In order to oversee the major players in the capital markets and regulate stock exchanges, an independent statutory entity called SEBI was created in 1988.
- The capital market was made available for portfolio investments, and Indian businesses were permitted to access global capital markets by issuing equity or shares overseas through Global Depository Receipts (GDR).
3.11.4.Impact of Economic Reforms of 1991
The economic reforms made in 1991 had a large-scale impact.
On various macroeconomic parameters (short-term)
- Within 2.5 years, inflation dropped from a peak of 17 percent in August 1991 to roughly 8.5 percent.
- Forex reserves increased from $1.2 billion in June 1991 to nearly $15 billion in 1994.
- GDP growth rate increased from 1.1% in 1991–1992 to 4% in 1992–1993
- The fiscal deficit decreased from 8.4%% in 1990–1991 to 5.7% in 1992–1993
- Between 1990–1991 and 1993–1994 exports nearly doubled.
On poverty reduction (long term)
Growth contributes to the reduction of poverty in two ways: first, through the percolation (trickle-down) impact, and second, by enabling the government to raise more funds to support increased social sector spending. So, in order to significantly reduce poverty, two strategies are required:
- allowing rapid economic growth, and
- concentrating on specialized programs to assist the underprivileged and needy
The Indian economy grew at a faster rate of 6.3 percent when we started the reforms in 1991, which enabled the government to raise more resources and pull in a sizable population in the growth process.
However, despite all the reforms, a large portion of Indians remain impoverished. According to estimates from the Tendulkar Committee for 2011–12, there is still 21.9 percent (26.9 cr) of the population living below the poverty line. In addition to being impoverished, they lack the necessities that have been discussed since Independence and before.
On the disparity between rich and poor (long term)
According to data from the National Council of Applied Economic Research, the Gini coefficient in income for rural and urban areas rose from 0.52 in 2004-05 to 0.55 in 2011-12. (the higher the Gini coefficient higher the inequality).
According to data from the National Council of Applied Economic Research, the Gini coefficient in income for rural and urban areas rose from 0.52 in 2004-05 to 0.55 in 2011-12. (the higher the Gini coefficient higher the inequality). The conclusion is that poverty decreased faster but inequality rose throughout the post-reform period.
3.11.5.Conclusion
As a result of our inability to provide enough work opportunities for young people, the post-reform period has been referred to as a period of jobless growth. The creation of numerous high-quality jobs is currently India’s most urgent task since it is the only sustainable way to address chronic poverty; otherwise, the demographic dividend could turn into a nightmare of underemployment and unemployment.
The low rise in rural productivity in India is the other important issue, in contrast to China where rural entrepreneurship was the main economic driver for years.
According to Raghuram Rajan (2014), India simply redistributed resources to rural regions through transfer programs (redistribution) like the guaranteed rural job plan and the minimum support price (MSP) for crops, without the concurrent increase in farm production that increased the demand for goods and services and increased inflation.
However, since 2014, the government has boosted budgeted spending on rural infrastructure.
3.11.6. Assessment of Reforms
Although there is a broad consensus among most of the political parties on the desirability of reforms, considerable debate has emerged on the contents of the reform programme, their sequencing and pace as well as their implementation and impact.
The balance sheet of the Indian economy in the post-reform period is mixed. The overall post- reform growth rate has been higher than the average rate achieved during the pre-reform period, largely because of the services sector. The fiscal balance and inflationary tendency have been controlled. India is emerging as an important player in fields such as manufacturing and medical services. Robust export growth especially software exports, and rising remittances by Indian workers abroad have created a new confidence in the Indian economy. It has led to phenomenal growth in foreign exchange reserves. The growth competitiveness and the business competitiveness of the country are increasing. India is emerging as a stable growth engine and as a Big Emerging Market (BEM) in the world due to robust economic performance supported by a vibrant democracy, increasing young population, expanding middle class and domestic market and well-developed private sector.
However, this growth is not inclusive. First, the growth is skewed within the economy. For example, there is a great divide separating industry and agriculture, and the infrastructure, especially the rural infrastructure, is in an appalling state. Second, the reforms are just confined to the economy and they are not spreading to the social sector. The social sector including healthcare, education, social security, gender equity and environmental protection has suffered a setback owing to the decline of the public investment in this crucial area. Low spending by the government has led to growing inequity in education and a decline in the quality of education.
Indian society is marked by four great divides: rural-urban, rich-poor, and along gender and caste lines – which pervade every aspect of life, including social services. In each category, there is the existence of a disadvantaged section that finds it extremely difficult to get access to social services and thus gets left out.
Though there has been immense improvement since Independence, we do not yet have a system in place that is capable of providing access to public goods. As a result of liberalization, the state is increasingly transferring its constitutional responsibility of providing public goods to market forces. Hence, the state is failing to build human capability and to ensure dignity of life for every citizen of the country. Since the market operates on the basis of economic power, it excludes the common people and the marginalized sections that do not have economic power from its benefits. Free market, coupled with the lack of necessary state support in the social sector, has led to huge interpersonal and inter-regional inequalities. These inequalities have caused social instability manifested by increasing protests and farmers’ suicides.
Globalization, as shaped by the new development paradigm has given rise to large-scale human displacement and the consequent disappearance of many communities and cultures, and massive protests. The continuing paradox of India and Bharat – a fast-growing economy supported by a well-developed private sector and yet with persistent mass deprivation and no effective freedom – within the democratic framework in the country has given rise to the question of whether democracy and market are incompatible. While the market excludes common people from its outcome, democracy based on universal adult franchise includes all in economic benefits.
Nevertheless, the inherent exclusionary tendencies of the market can be limited only by the State through providing public goods and services to the marginalized and the excluded sections of the population and regions of the country. This can be done most effectively in India’s highly pluralist and participative democracy with a very competitive print and electronic media, since they put pressure on governments to focus on the deprived sections of the society.
To foster a more inclusive growth, we need to create new employment opportunities in rural areas, improve the quality of infrastructure (both the so-called ‘soft infrastructure’ – political and economic policies and institutions; and ‘hard infrastructure’ – roads, railways and ports) and improve human capabilities by prioritizing health and education.
Keeping these concerns in view, the government decided to introduce the second-generation reforms while continuing the beneficial measures of the first-generation reforms, or the reforms initiated in the early 1990s. The second-generation reforms focus on the predominant issues of contemporary India. These include:
(a) extending reforms to the states;
(b) creating infrastructure through public-private partnerships;
(c)reforming the labour market, agriculture, intellectual property rights regime and the telecom sector;
(d) improving governance through legal and political reforms;
(e)empowering the underprivileged;
(f) expanding primary education and improving quality of higher education;
(g) improving human-development sector through intensive engagement with civil-society actors; and (h) achieving environmental sustainability.
The aim of these reforms is not only to help turn India into a fast-growing economy, but also a knowledge economy by strengthening the knowledge sector; a strong democracy by building social capital; and finally a humane society with the highest levels of sustainable human development. In light of this, the government has introduced various reports, schemes and programmes which aim to eradicate poverty and unemployment and fulfill that long-awaited promise that Jawaharlal Nehru so eloquently describe
3.12 Economic Reforms in the Indian Economy during Modi Government
(Part 2)
Union Budget 2023: How PM Modi’s reforms in eight years armed India to be the next dragon in global economy
Synopsis
Union Budget 2023: India had just peeked into the list of top 10 economies in 2014. In a space of eight years, it has galloped to outshine its former ruler, the United Kingdom, to become the fifth-largest economy in the world. But India’s growth story is perhaps just starting.
Naysayers have often doubted India and its economic progress. Be it demonetisation or the goods and services tax that promised One Nation One Tax, some reforms did leave the door ajar for debate. However, in recent years India has emerged to be an economic powerhouse riding on key reforms and battling through the vices of a historic pandemic.
India had just peeked into the list of top 10 economies in 2014. In a space of eight years, it has galloped to outshine its former ruler, the United . Kingdom, to become the fifth-largest economy in the world. But, India’s growth story is perhaps just starting.
India is likely to surpass Germany in 2027 and most likely Japan by 2029 at the current rate of growth, according to a SBI research note. If true, the country will become the third-largest economy in the world in the next seven years—by 2029, next only to the US and larger rival China.
True, India’s economy has grown at a tremendous pace ever since economic liberalisation in 1991. However, a booster shot came during the Modi era.
Here are seven top economic reforms during Modi’s rule that set the launchpad for the country to become the next dragon of the world.
- GST
The Goods and Services Tax (GST) is arguably the high point of Modi’s reform scorecard. The five year old GST, which came into effect from 1 July 2017 has brought 1.3 million taxpayers into a unified indirect taxation system.
GST saw a roller-coaster ride in the initial days. However, it later witnessed record collections on a month-to-month basis, indicating its efficiency in plugging the revenue leakages.
Nonetheless, GST has several rough terrains to conquer – such as rationalisation of the tax slabs and fine tuning several products that attract the highest tax rate of up to 28%, Also, the GST regime has yet to include some key products, such as fuel, under its ambit.
GST Challenges:
The circulars / clarifications issued by State authorities are not accepted by Central Government officers and vice versa.
The simultaneous and multiple proceedings by State as well as Centre authorities is indeed stressful for taxpayers.
The conflicting rulings on the same issue by advance ruling authority of different States adds fuel to the fire.
Even after five and half years from implementation of GST, non-constitution of appellate tribunal has left taxpayers in hapless situations.
2)Banking Reforms
India’s banking sector was one of the biggest beneficiaries under the Modi regime. The tone for NPA-saddled banks was set in the first year of Modi 1.0 when the Economic Survey 2015-16 suggested four R’s – Recognition, Recapitalization, Resolution, and Reform – to address the problem of non-performing assets.
The government then went on to introduce the Insolvency and Bankruptcy Code (IBC) which helped banks recover their debts. To further strengthen banks and give them much needed capital, the Union government has periodically infused capital into state run banks – since FY15, the government has infused about Rs 3 lakh crore in state-run banks. As a result of the reforms, NPAs have now fallen to 6-year low of 7.6 per cent as on March 31, 2022 while the capital to risk-weighted asset ratio (CRAR) of banks have improved to 14.6 percent as of March 2022.
The mega merger of 10 state owned banks into four as part of its consolidation plan to create bigger size stronger banks in the public sector is another highlight of the banking reforms during the Modi rule. The sector, however, will be keenly watching budget announcements regarding PSB privatisation and the much touted Banking Laws (Amendment) Bill.
3)PLI Scheme
The Production Linked Incentive (PLI) scheme, across 14 key manufacturing sectors, was launched in 2020–21 to give Make in India initiative the required boost. The PLI Scheme incentivizes domestic production in strategic growth sectors where India has a comparative advantage. This includes strengthening domestic manufacturing, forming resilient supply chains, making Indian industries more competitive and boosting the export potential. The PLI Scheme is expected to boost production and employment significantly, with benefits extending to the MSME eco-system.
Recognizing the importance of semiconductors in the world economy, the Government of India has also launched a USD10 billion incentive scheme to build a semiconductor, display, and design ecosystem in India. The government is expected to further expand this scheme in the Budget 2023-24.
4)UPI
The unified payments interface (UPI) has revolutionised the way India does business. From paying the chaiwala to buying groceries in a supermarket to even paying for high end goods and transferring money, UPI has become the favourite payment option. Its huge popularity can be gauged from the fact that in the third quarter of this year, UPI clocked over 19.65 billion transactions in volume and Rs 32.5 lakh crore in terms of value. UPI person-to-merchant (P2M) and person-to-person (P2P) payments emerged as the most popular payment methods among consumers, accounting for 42 percent of total digital transaction volume in Q3 this year, according to data.
UPI has seen exponential growth over the years. UPI clocked over 19.65 billion transactions in volume and Rs 32.5 lakh crore in terms of value in the third quarter of this year alone – 88 percent increase in volume and over 71 per cent increase in value in the third quarter of 2022 as compared to the third quarter of 2021.
The success of UPI is based on being universally acceptable and zero priced.
“In the future, by bringing UPI and QR code together, we can take it to the last mile, thereby creating a tremendous secondary and tertiary impact on the economy. Over the next few years, UPI will lead the way as a great way to bring more people into the digital world, thus driving financial inclusion,” the Paytm spokesperson added.
5)JAM Trinity
First proposed in the Economic Survey of 2014-15, The Jan Dhan-Aadhaar-Mobile (JAM) trinity is another key reform of the Modi government. The then finance minister Arun Jaitley announced the linking of Jan Dhan scheme, Aadhaar and mobile numbers of all beneficiaries in 2016.
It helped the government stop subsidy leakages and ensure the poor get the full benefits of the schemes intended for them through Direct Benefit Transfer. It brought many who were financially excluded into the banking fold. The scheme proved to be a game changer during Covid times as the government could provide direct help to the people.
6)Bankruptcy Code reforms
Another major policy initiative of the BJP-led government is the Insolvency and Bankruptcy Code, or IBC, which makes it easier for banks to recover their defaulted loans. Implemented in 2016, it offered a one step mechanism for distressed businesses to resolve insolvency in an efficient and time bound manner. It allowed a speedy resolution of disputes and time-bound recovery of loans.
7)RERA
The Real Estate Regulation Authority (RERA) was another major reform which was introduced in 2016. It brought transparency to the sector which had become synonymous with fraud and unaccounted money. RERA made it mandatory for builders to register their projects before the start of the project. It also seeks to address other issues like pricing, quality of construction, and other charges.
The Indian real estate sector has been one of the most substantial contributors to India’s GDP growth and is expected to contribute ~13% to the country’s GDP over the next three years. To regulate, bring accountability and transparency along with protecting consumer interest, it was crucial for the government to monitor and maintain regulative oversight for this high-growth industry, said Anshuman Magazine, Chairman & CEO – India, South-East Asia, Middle East & Africa, CBRE. Hence, RERA came into existence which transformed the industry.
8)Gatishakti
The Modi government launched the PM Gati Shakti National Master Plan in October 2021. The Rs 100 lakh crore mega plan is expected to ensure logistical efficiency in business operations through the creation of infrastructure that improves connectivity. Dubbed as a game changer integral to India’s goal to become a $20 trillion economy by 2040, the master plan is expected to generate large-scale employment opportunities, cut down logistics costs, improve supply chains, and make local goods competitive globally.
Other notable reforms of the Modi government include PSU bank mergers, disinvestment, corporate tax cut, Ujjawala scheme, demonetisation, the National Single Window System, and the creation of the Bad Bank.
3.13 Integrating the Care Economy into the Monetized Economy through Women Empowerment:
Care work refers to those occupations that provide services that help people develop their capabilities, or the ability to pursue the aspects of their lives that they value. Examples of these occupations include child care, all levels of teaching (from preschool through university professors), and health care of all types (nurses, doctors, physical therapists and psychologists). Care work also includes the array of domestic unpaid work that is often disproportionately performed by women
Thus, the ‘care economy’ encompasses unpaid and informal caregiving work, often performed by women within households, while the ‘monetized economy’ involves formal, paid economic activities.
Unpaid care work at home is an important activity in which women tend to spend a significant amount of time .it is an activity that is typically unaccounted for in labor supply statistics. Gender distribution of unpaid care work in the household is skewed.
Female to male ratio of time to unpaid care work
| Country | Female to Male ratio of time devoted to unpaid care work |
| India | 9.83% |
| Algeria | 6.75% |
| Turkey | 6.22% |
| China | 2.57% |
| USA | 1.61% |
| Denmark | 1.3% |
| Uganda | 1.18% |
The table shows the female-to-male ratio of time devoted to unpaid services
Integrating the Care Economy into the Monetized Economy through Women Empowerment With reference to India
Empowering women within the care economy involves recognizing, valuing, and integrating the often unpaid and underappreciated caregiving roles they play into the formal, monetized sectors of the economy. This can be achieved through:
Skill Development Programs: Launch skill development initiatives focused on healthcare, elderly care, and early childhood education to empower women with marketable skills.
Example: The Indian government’s Skill India program offers training in healthcare and caregiving professions.
Income generating activities through Self Help Groups
Example: Kudumbashree Programme in Kerala
Entrepreneurship Opportunities: Encourage women to start small businesses related to the care economy, such as setting up daycare centres, nursing services, or home healthcare agencies.
Example: “Nari Shakti” grants by the Indian government support women entrepreneurs in various sectors.
Flexible Work Arrangements: Promote flexible work policies that allow women to balance caregiving responsibilities with formal employment.
Example: Companies offering work-from-home options, aiding women’s participation.
Equal Pay and Fair Recognition: Advocate for equal pay for equal work to recognize the contributions of women in caregiving roles, both paid and unpaid.
Example: The Equal Remuneration Act in India mandates equal pay for men and women.
Affordable Childcare Services: Develop affordable, government-subsidised childcare centres to relieve women from caregiving burdens and enable their participation in the workforce.
Example: The Integrated Child Development Services (ICDS) program in India provides early childhood care and nutrition support.
Supportive Government Policies: Implement gender-inclusive policies, such as maternity leave, parental leave, and anti-discrimination measures, to enhance women’s economic participation.
Example: The Maternity Benefit (Amendment) Act in India extends paid maternity leave to 26 weeks.
By including the unpaid domestic work and caregiving in GDP calculations, the contribution of women will get due recognition. Such an inclusion of care giving activities in GDP calculations will improve the economic status of women and help their empowerment.
- Recognize Unpaid Work: Acknowledge and value unpaid caregiving labor in national accounting systems, highlighting its significance.
- Support Care Infrastructure: Invest in infrastructure such as childcare facilities and eldercare services to make caregiving more accessible and efficient.
- Education and Training: Provide training and educational opportunities for individuals pursuing careers in caregiving professions, enhancing their earning potential.
- Flexible Work Arrangements: Encourage flexible work arrangements, allowing caregivers to participate in the monetized economy while fulfilling caregiving responsibilities.
- Public-Private Partnerships: Foster collaboration between public and private sectors to create caregiving solutions and services.
- Incentivize Employers: Offer tax incentives and benefits to businesses that support employees’ caregiving needs.
- Universal Health Care: Ensure universal access to healthcare, reducing the burden of caregiving on families.
- Gender Equality: Promote gender equality in the workplace and at home, reducing the disproportionate caregiving responsibilities placed on women.
- Social Safety Nets: Establish social safety nets to provide economic security for caregivers during times of need.
- Data Collection and Research: Continuously collect data on the care economy’s impact and develop policies based on evidence to optimize its integration.
- Promoting Skill Development: Offer skill development programs to women in the care sector, enabling them to pursue career opportunities in healthcare.
Conclusion:Empowering women to monetize the care economy is not only a matter of economic significance but also a step toward gender equality and social progress. Recognizing and valuing their contributions in caregiving roles can unleash their potential, boost the economy, and improve the overall well-being of society.
Today, there are four parts of the economy: Business, Household, Public, and Non-profit. Typically, we only think that the business sector creates any wealth, and that the other three serve the business sector and alongside it. The truth is that all four parts of the economy generate wealth, and that wealth flows over into other sections of the economy as well. Part of the reason that unpaid care work is largely ignored is because of this belief that the household does not form wealth. In reality, the household prepares children for the other parts of the economy, and without that, none of the other sectors would flourish
3.14 Distinguish between ‘Care Economy’ and ‘Monetised Economy’
| Aspect | Care Economy | Monetized Economy |
| Focus | Emphasizes the provision of care, support, and services for well-being and human development. | Primarily concerned with the exchange of goods and services for monetary gain. |
| Currency | Not solely driven by money; values unpaid labor, emotional support, and social connections. | Driven by monetary transactions and profit generation. |
| Activities | Includes caregiving, volunteer work, family support, education, healthcare, and social services. | Comprises industries like manufacturing, finance, technology, and retail. |
| Motivation | Rooted in social and community well-being, emphasizing quality of life and social bonds. | Often motivated by profit maximization, competition, and economic growth. |
| Measurement | Difficult to quantify in monetary terms; values often underestimated in traditional economic metrics. | Measured in terms of monetary transactions, GDP, and financial indicators. |
| Public vs. Private | Often involves unpaid or underpaid work performed within families and communities, as well as formalized caregiving professions. | Primarily consists of private sector businesses and profit-driven entities. |
| Externalities | Positive social externalities, like stronger communities and social cohesion. | May generate negative externalities, such as environmental degradation and inequality. |
| Gender Dynamics | Often disproportionately carried out by women, leading to gender-based inequalities. | Generally less influenced by gender disparities, but disparities can exist. |
| Policy Considerations | Advocates for recognizing and compensating unpaid care work and promoting work-life balance. | Focuses on regulation, taxation, and economic growth strategies. |
| Contribution in GDP | Mostly unaccounted | Mostly accounted |
| Labor Force Participation | Involves a significant portion of unpaid caregivers and healthcare professionals.
Involves a mix of paid professionals (e.g., nurses, caregivers) and unpaid caregivers (e.g., family members |
Comprises formal employment sectors, where workers are compensated monetarily.
Mostly paid workers Example: India’s Information Technology (IT) sector employs millions in formal, salaried positions…. |
3.15 Different phases of Recoveries in the Economy
“V’ Shape recovery and other shapes of Recoveries
In an Economy number of ups and downs are coming for no.of reasons. The best example is recently faced the Covid-19 Pandemic by almost all the world economies in which each economy faced sharp fall in all economic indicators and when recovery phase from pandemic started all the economies showed steep rise in almost all indicators. When we plot these indicators on a graph it look like a alphabet “V”, which means there is sharp fall in the economy and subsequently sharp recovery in the economy. To understand that all the shapes of recoveries we had given a diagram at the end for each shaped recovery to understand them better.
3.15.1.SHAPES OF ECONOMIC RECOVERY
- Economic recovery can take many forms, which is depicted using alphabetic notations. For example V-shaped recovery, U-shaped recovery, elongated U-shaped recovery, W-shaped recovery and L-shaped recovery.
- The fundamental difference between the different kinds of recovery is the time taken for economic activity to normalize.
- In this article, let’s try to take a brief look how L, V, U & W Shaped economic recovery compare.
3.15.2 V–shaped
A V-shaped recovery is a quick, sharp improvement in an economy after a sharp decline. On a graph of gross domestic product (GDP) over time, the decline forms the left side of the letter V. The recession is the point at the bottom, then rapid improvement from that point forms the right side of the letter V.
A V-shaped recovery usually characterizes a recovery after a recession caused by a one-time shock. As a consumer, business-owner, investor, or other participant in the economy, it helps to understand how a V-shaped recovery works.
- A V-shaped recovery in an economy can happen due to a number of factors, including monetary policies and unpredictable environmental or political conditions. Economic downturns, in general, can happen due to a variety of reasons.
- These include events that are hard to prepare for, like war, a pandemic, or natural disasters. When occurrences like these happen, they can cause severe disturbances to important economic indicators and factors such as:
- Gross domestic product (GDP)
- Stock indexes
- Income
- Employment
- Manufacturing
- Retail sales
Example – Covid-19 Pandemic of 2020
The Covi-19 Pandemic of 2020 caused several indicators in nearly all countries to plummet as the world was forced to shut its doors. This led to severe declines in things like industrial production, employment, and GDP.
One can identify a V-shaped recovery by the sharp correction in these economic factors, signaling that the economy is recovering rapidly. The correction will be sharp. As the economy finds a floor or bottom, indicators will bounce and correct to levels achieved before the event occurred.
The Recession of 1953
The recession of 1953 in the United States is another clear example of a V-shaped recovery. This recession was relatively brief, and mild with only a 2.2% decline in GDP and unemployment rate of 6.1%. Growth began to slow in the third quarter of 1953, but by the fourth quarter of 1954 was back at a pace well above the trend. Therefore, the chart for this recession and recovery would represent a V-shape.
For an economy to achieve a V-shaped recovery, it often takes aggressive actions from the government and, in many instances, the private sector. Therefore, a V-shaped recovery is a best-case scenario for an economy to recuperate the losses and continue to grow and expand.

3.15.3 L–shaped recovery
An L–shaped recovery is a type of recovery characterized by a slow rate of recovery, with persistent unemployment and stagnant economic growth. L-shaped recoveries occur following an economic recession characterized by a more-or-less steep decline in the economy, but without a correspondingly steep recovery.
Example – Lost decade in Japan
What is known as the lost decade in Japan is widely considered to be an example of an L-shaped recovery. Leading up to the 1990s, Japan was experiencing remarkable economic growth. In the 1980s, the country ranked first for gross national production per capita. During this time, real estate and stock market prices were quickly rising. Concerned about an asset price bubble, the Bank of Japan raised interest rates in 1989. A stock market crash followed, and annual economic growth slowed from 3.89 percent to an average of 1.14 percent between 1991 to 2003.

3.15.4 U–shaped recovery
A U–shaped recovery describes a type of economic recession and recovery that charts a U shape, established when certain metrics, such as employment, GDP, and industrial output sharply decline and then remain depressed typically over a period of 12 to 24 months before they bounce back again.
Examples of U-shaped recoveries are the 1973-75 Nixon recession and the 1990-91 recession following the S&L crisis in US.

3.15.5 W-shaped Recovery
A W-shaped recovery is when an economy passes through a recession into recovery and then immediately turns down into another recession. A W-shaped recovery involves a sharp decline in these metrics followed by a sharp rise back upward, followed again by a sharp decline and ending with another sharp rise. The middle section of the W can represent a significant bear market rally or a recovery that was stifled by an additional economic crisis.
Example – US economy in 1980’s
The United States experienced a W-shaped recovery in the early 1980s. From January to July 1980 the U.S. economy experienced the initial recession, and then entered recovery for almost a full year before dropping into a second recession in 1981 to 1982.
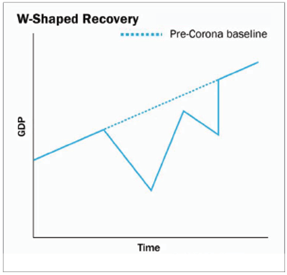
3.15.6 K-shaped recovery
A K-shaped recovery is a post-recession scenario in which one segment of the economy begins to climb back upward while another segment continues to suffer. If illustrated, the economic growth would roughly resemble the two diverging diagonal lines of the letter “K” – hence the name.
While V-shaped, U-shaped, and W-shaped recoveries have been around for decades, the concept of a K-shaped recovery first emerged in 2020 during the COVID-19 pandemic.
In a K-shaped economy,
Households at the top of the pyramid are likely to have seen their incomes largely protected, and savings rates forced up during the lockdown, increasing ‘fuel in the tank’ to drive future consumption.
Meanwhile, households at the bottom are likely to have witnessed permanent hits to jobs and incomes,
What’s particularly concerning about a K-shaped recovery is the way it splinters the economy, continually widening the gap between those who are doing well and those who are not.
In the end, a K-shaped recovery makes any existing problems of economic inequality much worse.

3.15.7. J –Shaped recovery
The J-shaped recovery is a somewhat unrealistic scenario, in which growth rises sharply from the lows much higher than the trend-line and stays there.
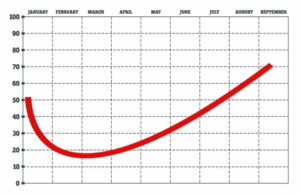
3.15.8. Z- Shaped recovery
The Z-shaped recovery is the most-optimistic scenario in which the economy quickly rises like a phoenix after a crash. It more than makes up for lost ground (think revenge-buying after the lockdowns are lifted) before settling back to the normal trend-line, thus forming a Z-shaped chart.
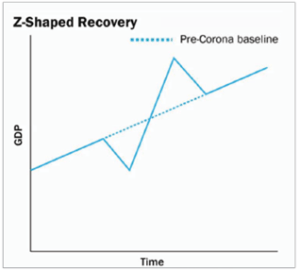
3.16 State of the Indian economy in S-Curve, where income is growing at faster pace.
As the world’s fastest-growing economy for the past two years, India experienced several developments in 2023 that heighten foreign investor confidence.
A Reuters’ report notes that India is now reaching the pivotal phase of the S-curve, characterized by a significant acceleration in urbanization, industrialization, household incomes, and energy consumption. This phase typically spans several decades, marked by rapid growth in these key factors.
Boasting a GDP of US$3.75 trillion, India is the fifth largest economy in the world. The per capita income, per government data, was INR 98,374 in 2022-23 (approx. US$1,183). Further, Reserve Bank of India (RBI) Deputy Governor Michael D Patra told media last month that the Indian economy was on track to hit US$5 trillion by 2027 on the back of developments in the financial sector and the country’s demographic advantage.
3.16.1 GDP growth
The country’s real gross domestic product (GDP) or GDP at constant prices (2011-12) registered a faster-than-expected growth rate of 7.6 percent in the July-September quarter of 2023. In its October forecast, the IMF had noted that India’s real GDP would increase beyond 6 percent in 2023 and 2024. This would put its compound annual growth above China’s at 4-5 percent and above the world economy (3 percent) and that recorded in advanced economies (1.5 percent).
3.16.2 Stock market
India’s Nifty 50 index, hit a new high, up 16 percent this year. Per reporting in CNBC, it has surpassed Hong Kong’s Hang Seng index, which fell 18 percent. India’s stock market is now the seventh largest with a market capitalization of US$3.989 trillion. High performing sectors predicted for 2024 include banking, healthcare, and energy while consumer goods, utilities, and chemicals could lag.
3.16.3 Manufacturing PMI
In November 2023, the S&P Global India Manufacturing PMI rebounded to 56.0 from October’s eight-month low of 55.5, aligning with market expectations. This marked the 29th consecutive month of expansion in factory activity. India’s manufacturing sector also witnessed growth in new orders—rebounding from October’s one-year low—and foreign sales extended their growth streak for the 20th month, albeit at the slowest rate of growth since June. Additionally, employment witnessed its eighth consecutive monthly increase, accompanied by a slight uptick in outstanding business. The rise in buying activity and input stocks was notable, driven largely by robust demand conditions. The output of eight key infrastructure sectors jumped 12.1 percent in October 2023 against 0.7 percent expansion in the year-ago period on the back of a sharp uptick in production of coal, steel, cement, and electricity. The eight core sectors—coal, crude oil, natural gas, refinery products, fertilizer, steel, cement and electricity—contribute 40.27 percent to the Index of Industrial Production (IIP).
The manufacturing sector currently contributes about 17 percent of the Indian GDP, which is hoped to grow to 21 percent in the next six to seven years. The government wants the Indian manufacturing market to reach around US$1 trillion by 2025-26.
3.16.4 Government spending
Government spending rose 12.4 percent in the July-September quarter after a contraction in the April-June quarter, likely due to the lead up to key state elections in November.
Given the weak consumer spending and lagging private sector investment, the government had announced record capital expenditure (capex) plans earlier in the year in the Union Budget announced February 1, 2023. A major challenge for India continues to be recovering demand in the rural economy.
In its 2023-24 Budget, the government ramped up spending plans, at US$122 billion, for building roads, highways, and power plants, among others. Regional connectivity through 50 new airports, aerodomes, and heliports was also announced as well as increased spending on affordable housing projects to the tune of about US$10 billion.
3.16.5 Investment climate
A policy and spending focus on enhancing infrastructure and logistics connectivity, coupled with efforts to streamline bureaucracy, has led to significant global multinational corporations (MNCs) redirecting their investments to India.
The country is increasingly being chosen as a key production and assembly base in Asia, thanks to these strategic initiatives.
3.16.6 PLI program
Various production-linked incentive (PLI) schemes have resuscitated the manufacturing sector post-pandemic. They are helping build up critical value chains and industrial clusters in India, besides expanding the country’s export basket. Overall, the 14 PLI schemes have brought in a new regulatory framework, which can be aligned to address industrial and manufacturing technology deficiencies and improve output. The government is also contemplating extending the scheme to further sectors, to develop new segments in labor-intensive sectors.
3.16.7 What Growth Really Looks Like
In order to adopt the right mindset for sustaining momentum, you should get a feel for the big picture of growth.
Once you get past the initial upswing, the life cycle of a successful economy takes on the form of a sigmoid, or S curve. The S shape represents growth over time—starting out slowly, picking up speed during rapid growth, then tapering off as growth slows.
Four stages of S- Curve
1.Start
2.Growth
3.Mature.
4.Decline

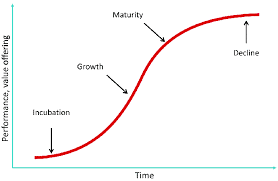
Prof. Ram Singh of Delhi School of Economics opined that our economy is approaching fast to become 4 Trillion economy this year because our economy is in “S- Curve” where income grows fast.
In his opinion Indian economy will be in bright spot in the whole world. This year growth rate will be much higher than 6.5% and compound growth will also be higher than China (4-5%)..India’s growth is expected to four times of the growth rate of developed economies, which is at present average around 1.5%..It is pertinent to note that Indian economy is appearing in “S-Curve”, when Urbanization, Industrialization, Domestic Income and Energy Consumption is rapidly increasing. Thus when an economy reaches in “S-Curve” the economy growth rate is accelerated at much faster rate. This indicates the improvement in Investment, Technological advancement and Productivity, which look like alphabet ’S”. Our population growth chemistry is very similar to china which it had during 1990 to 2000 decade. China plunged in to high growth rate during the era and continued with same pace for almost two decade. It appears that now India has reached in that stage where china was. This is quite possible that the forthcoming two decades may belong to India. By 2045 India’s growth rate is expected to remain on an average 3.5% higher than the China.. Due to these expectations, Goldman Sachs, Morgan Stanley, Moody’s etc. renowned Broking and Investment agencies hopefully gave their opinion that India will play a pivotal role in the world in ensuing 25 years. They also expect that India will reach to 4 Trillion target this year. S& P Global expected that by 2030 Indian economy may reach to 7.3 Trillion level when it will be capable to become Asia’s biggest economic power pushing back to Japan on second position. .
3.16.2 Prof Ram Singh has given following reasons for faster growth of the Indian economy:
1 .Per Capita Income– Our per capita income (PPP) is at present accounted to.Rs.5.9 Lakh which China had in 2007, thereafter China grew at a faster rate. Our average age is 27.9 years, where China was in 1998. It means Indian economy has not yet reached to its peak and therefore, this is the biggest opportunity for the Indian economy to grow.. It is expected that by 2044 both the countries will be at same level.
- Our work force population (15-64Years) is increasing where as in China it is decreasing.
3.Energy Consumption: At present in India it is about 26 Gigajoule energy consumption which China had during 90th decade. It is expected that energy consumption may increase upto 81% during 2022-25 period.
- Urbanisation: Our 35% population lives in cities which China had during 2000.In our country during 2010- 21 urban population increased by 19.6% which constitutes 35% of our total population. China touched this level during 2000. Further, our population aged upto 50 years constitutes 80% of our population and this is also a fact that most of the rural population is moving towards to urban areas for better opportunities.
- Faith: The developed economies now having more faith in our economy ,which they had in the China in the past.. When we compare Per capita GDP it was in our country at 5.2% as compared to China 4.5% during 2010-19 decade, our economy is showing better prospects. As per Brookings Institute,in India unemployment rate remained at 4.1%, which is lowest in the last decade, where as China has stopped publicizing the data of unemployment for the age group 16-24 Years. Resulting in number of Investment companies are moving out from the China.
- Women Work Force: The trend shows that women are now outnumbering men in learning Science, Technology, English and Math’s education, which now constitutes 43% thus stood at number one position, whereas America stood at second position where around 32% participation of females registered. This trend shows that in the ensuing two decades women ‘s labour participation may reach upto 55%.
Economics at fingertips
Indian Economy
| Sl No. | Subject matter | Important points to remember |
| 1 | Indian Economy and its characteristics | The Indian economy is seen to have maintained its growth momentum in the second quarter of Financial Year 2023-24 (Q2 FY24) and is estimated to have grown about 7% with robust factory expansion and higher consumption |
| 2. | The Key determinants |
|
| 3. | Contributor factors of Robust Growth |
|
| 4 | Challenges: |
|
Annexure to Chapter 3-Indian Economy
Daily Series Economics at Fingertips
| Sl.No. | Topic | Things to remember |
| 1 | INDIAN ECONOMY – PRE INDEPENDENCE-ERA (BEFORE 1947) | India had an independent economy before the advent of British rule.
India was particularly well known for its handicraft industries in the fields of cotton and silk textiles, metal and precious stone works etc. Aim of the British colonial rule in India – To reduce the country to being a feeder economy for Great Britain’s own rapidly expanding modern industrial base. A fundamental change in the structure of the Indian Economy-India was transformed into a net supplier of raw materials and consumer of finished industrial products from Britain. The colonial government never made any sincere attempt to estimate national and per capita income of India. Notable estimators were – Dadabhai Naoroji (Poverty and Un-British Rule in India), William Digby, Findlay Shirras, V.K.R.V. Rao (considered very significant) and R.C. Desai
AGRICULTURE SECTOR Agrarian Economy – Indian economy under the British rule was fundamentally agrarian i.e. about 85 percent of the country’s population lived mostly in villages and derived livelihood directly or indirectly from agriculture. Stagnated agriculture sector – Reason being over- crowded with involvement of maximum population leading to a very low agricultural productivity, in absolute terms. However, the sector experienced some growth due to the expansion of the aggregate area under cultivation. Pertaining to systems of land settlement, the profit accruing out of the agriculture sector went to the zamindars instead of the cultivators with no zamindars initiating to strive for the development of agriculture. Lack of agricultural inputs – Low levels of technology, lack of irrigation facilities and negligible use of fertilisers resulted in a dismal level of agricultural productivity and efficiency. India’s agriculture was starved of investment in terracing, flood-control, drainage and desalination of soil. Commercialisation of agriculture – could hardly help farmers in improving their economic condition as they were producing cash crops which were to be ultimately used by British industries back home. Partition of the country: A sizeable portion of the undivided country’s highly irrigated and fertile land went to Pakistan leading to an adverse impact upon India’s output from the agriculture sector especially, Jute industry (whole of the area went away to East Pakistan)
INDUSTRIAL SECTOR India could not develop a sound industrial base even while carrying the legacy of churning out the best handicraft stuff in the world – it declined rapidly and no corresponding modern industrial base was allowed to take its place. Policy of systematic deindustrialisation – To reduce India to the status of a mere exporter of important raw materials for the upcoming modern industries in Britain. To turn India into a sprawling market for the finished products of those industries so that their continued expansion could be ensured to the maximum advantage of Britain. Decline of the indigenous handicraft industries created massive unemployment and rural distress in India. Cotton and jute textile mills were mainly concentrated in the western parts of the country – Maharashtra and Gujarat (Indians). During the second half of the nineteenth century, modern industry began to take root in India but its progress remained very slow and stagnant. Iron and steel industries began to rise up – The Tata Iron and Steel Company (TISCO) was incorporated in 1907. Other industries like sugar, cement, paper etc. came up after the Second World War. Capital goods industry – Though necessary to help promote further industrialization, this industry did not bloom. Growth rate of the new industrial sector and its contribution to the Gross Domestic Product (GDP) remained dismal and piecemeal. The industrial sector thus, was left out crying for modernisation, diversification, capacity building and increased public investment. Limited area of operation of the public sector— it remained confined only to the railways, power generation, communications, ports and some other departmental undertakings. Aim of the British colonial rule in India – To reduce the country to being a feeder economy for Great Britain’s own rapidly expanding modern industrial base.
FOREIGN TRADE • India has been an important trading nation since ancient times. • Restrictive policies of commodity production, trade and tariff made India an exporter of primary products (raw silk, cotton, wool, sugar, indigo, jute etc.) and an importer of finished consumer goods (cotton, silk and woollen clothes and capital goods like light machinery) produced in the factories of Britain • Britain maintained a monopoly control over India’s exports and imports, leading to more than half of India’s foreign trade to be restricted to Britain while the rest was allowed with a few other countries like China, Ceylon (Sri Lanka) and Persia (Iran). • The opening of the Suez Canal further intensified British control over India’s foreign trade • Several essential commodities such as food grains, clothes, kerosene etc. suffered acute scarcity in the domestic market. • The expenses incurred by an office, set up by the colonial government in Britain and expenses on war fought by the British government were accrued from revenue generated from India.
DEMOGRAPHIC TREND First documentation of the population of British India was conducted through the 1881 (decennial) census. This census revealed the unevenness in India’s population growth. India’s stages of demographic transition: 1st stage: Before 1921 2nd stage: After 1921 – Neither the total population of India nor the rate of population growth at this stage was very high and the various social development indicators were also not quite encouraging. Overall literacy level: less than 16 per cent; (the female literacy level was at about seven per cent) Public health facilities: either unavailable to the larger population or, when available, were grossly inadequate. Rampant occurrence of water and airborne diseases taking a huge toll of life The overall mortality rate was very high and the infant mortality rate was quite alarming- about 218:1000 Life expectancy was also very low – 32 years Extensive poverty prevailed in India during the colonial period which contributed to the worsening profile of India’s population of the time
OCCUPATIONAL STRUCTURE Occupational structure connotes the distribution of working persons across different industries and sectors Very little signs of changes in occupational structure witnessed during the colonial period. Largest share of the workforce is about 70-75 per cent witnessed in agriculture. Manufacturing and the services sectors accounted for only 10 and 15-20 per cent growth in regional variation respectively. The parts of the then Madras Presidency, Maharashtra and West Bengal witnessed a decline in the dependence of the workforce is about 70-75% witnessed in Agriculture. Manufacturing and the services sector accounted for only 10 and 15-20 percent growth in regional variation respectively. The parts of the then Madras Presidency, Maharashtra and West Bengal witnessed a decline in the workforce on the agricultural sector with a commensurate increase in the manufacturing and the services sectors Orissa, Rajasthan and Punjab experienced an increase in the share of Workforce in agriculture during the same time. Occupational Structure (Labour Distribution%) 1950/51 Agriculture 72.3 Industry Total 10.7 Trade & Transport 7.7 Services 9.3 INFRASTRUCTURE ▪ To sub-serve various colonial interests (not to provide basic amenities to the people), development of basic infrastructure (railways, ports, water transport, posts and telegraphs) took place in India. ▪ Roads- o To mobilize the army within India o To draw out raw materials from the countryside to the nearest railway station or to the ports to send these to far away England o To reach out to the rural areas during the rainy season. ▪ Railways- o Introduced in 1850s by Lord Dalhousie o Enabled people to undertake long distance travel thereby breaking geographical and cultural barriers o facilitated commercialisation of Indian agriculture which adversely affected the comparative self-sufficiency of the village economies in India o Volume of India’s export trade expanded with benefits rarely being accrued to the Indian people o Social benefits outweighed the country’s huge economic loss with the ‘railways’ needing further upgradation, expansion and public orientation ▪ Electric telegraph served the purpose of maintaining law and order in remotest parts. ▪ Postal services were useful but remained inadequate. ▪ Development of the inland trade and sea lanes – Mixed reaction to the development of these as sometimes they proved uneconomical (Coast Canal on the Orissa coast) |
| 2 | Types of Economic Systems | Capitalist (Market) Economy System
I) In a capitalist system, the products manufactured are divided among people not according to what people want but on the foundation of Purchasing Power – II) which is the ability to buy products and services. Which means an individual needs to have the money with him to buy the goods and services. Example – The affordable housing for the underprivileged is much required but will not include demand in the market because the needy do not have the buying power to back the demand. III) Therefore, the commodity will not be manufactured and provided as per market forces.
SOCIALIST ECONOMIC SYSTEM In a socialist society, the government determines what products are to be manufactured in accordance with the requirements of society. It is believed that the government understands what is appropriate for the citizens of the country, therefore, the passions of individual buyers are not given much attention. The government concludes how products are to be created and how the product should be disposed of. In principle, sharing under socialism is assumed to be based on what an individual needs and not what they can buy. A socialist system does not have a separate estate because everything is controlled by Government
3.Mixed Economic System
It is a golden combination of a command (Socialist) economy and a market (Capitalist) economy. For this purpose, the mixed economic systems are also called dual economic systems. However, there is no sincere method to determine a mixed system, sometimes the word represents a market system beneath the strict administrative control in certain sections of the economy.
|
| 3 | Meaning of Plan | A plan spells out how the resources of a nation should be put to use. It should have some general goals as well as specific objectives which are to be achieved within a specified period of time;
In India plans are of five years duration and are called five-year plans (we borrowed this from the former Soviet Union). Our plan documents specify the objectives to be attained in the five years of a plan and what is to be achieved over a period of twenty years (called as perspective plan) Five-year plans of India do not spell out how much of each and every good and service is to be produced.
In 1950, the Planning Commission was set up with the Prime Minister as its Chairperson and the era of five-year plans had begun.
|
| 4 | Types of Economic Planning | Directional planning
Directional type of planning followed by countries which believe in socialism. The targets of plans are pre-determined and executed with the help of the government in power. In Directional type of planning all things are under control of the state including, financial institutions, industrial sector, transport, infrastructure, etc.
Planning by inducement This planning is independent planning. In this type, the state regulates and controls the process of production, forming the enterprise and various patterns of consumption. The government formulates various monetary and fiscal policies to regulate the economy effectively.
Perspective planning Perspective planning is long term planning for a time period of 20 to 25 years. It’s an outline of development to be undertaken over a longer period in a phased manner. They can further be divided into annual plans. These five-year plans generally maintain continuity.
Indicative Planning Indicative planning is a comparatively flexible type (soft planning) of planning, as it is different from comprehensive or imperative planning. It works on decentralized principles in the completion of target plans. In this planning, the targets for the public sector are mandatory while for the private sector they are only indicative. It was initially used in countries like France and Japan.
Imperative Planning In this, the government in power directs and controls all the economic activities and resources in the economy. All available resources are used with high efficiency to complete set targets of the plan. Since the government’s decision and policymaking is very rigid, they are to be followed by the market players. Imperative planning is in use in Russia and China.
Democratic planning The basic ideology in democratic planning is to form the democratic form of government. Plan are prepared according to the requirement and needs of the people. The discussion with various parties involved in the economy is the main principle of democratic planning. Aim of democratic planning is eradicating inequalities of income and wealth.
Fixed planning • Plans are prepared for a fixed period of time. The objectives and targets of a fixed plan are to be achieved within the plan period. Physical targets and spending on these targets are often not changed except during an emergency. Fixed planning is used in India.
Centralized Planning • The centralized authority plans and formulates all planning activities in the country in centralized planning. This authority fixes targets for all industries and fixes priorities for all sectors. It takes all the investment decisions according to the goals and targets set in the plan.
Decentralized Planning • In decentralized planning, the plans are executed at grass root level. In this, the plan is prepared by central authority along with discussion with all the administrative units in the country whether at state level or district level. Plans for industries are prepared with full discussion with all the major representative stakeholders in the industries. |
| 5 | INDIAN ECECONOMY – POST-INDEPENDENCE ERA (1950-1990)
|
A.PRE-INDEPENDENCE PLANNING IN INDIA
i) M. Visvesvaraya published his book “Planned economy in India” in 1934. In this book he presented a constructive draft of the development of India in 10 years. His core idea was to lay out a plan to shift labour from agriculture to industries and double up National income in ten years. This was the first concrete scholarly work towards planning. The economic perspective of India’s freedom movement was formulated during the Karachi session of INC (1931), Faizpur session of INC 1936 ii) National Planning Committee (1938) – was the first attempt to develop a national plan for India. This committee was set up by Congress president Subhash Chandra Bose and was chaired by Jawaharlal Nehru. However the reports of the committee could not be prepared and only for the first time in 1948-49 some papers came out. iii) Bombay Plan – In 1944, Industrialists of Bombay including Mr. JRD Tata, GD Birla, Purshottam Das Thakur Das, Lala Shriram, Kasturbhai Lalbhai, AD Shroff, Ardeshir Dalal, & John Mathai working together prepared “A Brief Memorandum Outlining a Plan of Economic Development for India” which was popularly known as Bombay Plan. This plan envisaged doubling the per capita income in 15 years and tripling the national income during this period. Iv) In August 1944, The British Indian government set up a “Planning and Development Department” under the charge of Ardeshir Dalal. But this department was abolished in 1946. v) People’s Plan – Plan was based upon Marxist socialism and drafted by M N Roy. This plan was for a ten years period and gave greatest priority to Agriculture. Nationalization of all agriculture and production was the main feature of this plan. vi) • Gandhian Plan (1944) – Put forward by Sri Shriman Narayan in 1944 who was principal of Wardha Commercial College. It was a modest kind of plan. Plan emphasized economic decentralization with primacy to rural development by developing cottage industries vii) Sarvodaya Plan (1950) – Plan was drafted by Jaiprakash Narayan inspired by Gandhian plan as well as Sarvodaya Idea of Vinoba Bhave. It emphasized on small and cotton industries and agriculture as well. Plan also stressed upon land reforms and decentralized participatory planning.
B. POST-INDEPENDENCE i) Economic Programme Committee (EPC) – formed by All India Congress Committee (AICC) with Nehru as its chairman. The aim of this committee was to make a plan which could balance private and public partnership and urban and rural economies. The EPC recommended in 1948 to form a permanent Planning Commission in India. In March 1950 in pursuance of declared objectives of the Government, the Planning Commission was set up by a Resolution, with Jawaharlal Nehru as the first Chairman of the Planning Commission. The Planning Commission was charged with the responsibility of making assessment of all resources of the country, augmenting deficient resources, formulating plans for the most effective and balanced utilization of resources and determining priorities.
|
| 6 | The Goals of Five-Year Plans | 1. GROWTH: Growth refers to an increase in the country’s capacity to produce the output of goods and services within the country.
Good indicator of economic growth is the steady increase in the country’s Gross Domestic Product (GDP) – the market value of all the goods and services produced in the country during a year. The GDP of a country is derived from the different sectors (Primary, Secondary and Tertiary) of the economy – the contribution made by each of these sectors makes up the structural composition of the economy.
2. MODERNIZATION: Steps taken by a factory to increase output by using a new type of machine and technology is called modernization Modernisation also leads to changes in social outlook such as the recognition that women should have the same rights as men. 3. SELF RELIANCE: A nation can promote economic growth and modernisation by using its own resources or by using resources imported from other nations. The first seven five-year plans gave importance to self-reliance which means avoiding imports of those goods which could be produced in India itself, in order to reduce our dependence on foreign countries, especially for food. There was a fear that dependence on imported food supplies, foreign technology and foreign capital may make India’s sovereignty vulnerable to foreign interference in our policies. Recently, PM stressed for a self-reliant India (Atma Nirbhar Bharat) in the backdrop of the Covid-19 outbreak. 4. EQUITY: To ensure that the benefits of economic prosperity reach the poor sections as well instead of being enjoyed only by the rich – every Indian should be able to meet his or her basic needs such as food, a decent house, education and health care; and reducing inequality
|
| 7 | OBJECTIVES OF PLANNING
|
1) Economic and social planning and ensuring pattern of the ‘welfare state’.
2) Sustainable economic growth. 3)Poverty alleviation 4)Employment generation and self-employment 5)Modernizing the traditional economy was set as a foremost objective of planning especially the agriculture sector 6) Accord due place and weightage to all the aspirations of the Preamble, the Fundamental Duties, the Fundamental Rights and the Directive Principles of the State Policy – adequate means of livelihood, opportunities for employment and a socio-economic order based on justice and equality. 7) Self-reliance – an effort to strike against a subordinate position in the world economy. 8)Ensuring economic equality
|
| 8 | FINANCIAL RESOURCES FOR PLANNING
|
1.Central budget and state budgets – revenue and capital receipt side
2.Public Sector Enterprises (PSEs) 3.Domestic private sector 4. Gross Budgetary Support – This is an amount from the central budget which goes to fund the planned investment during the plan period. 5. • Foreign Direct Investment (FDI) in India |
| 9 | PRIME MOVING FORCE – AGRICULTURE VS.
INDUSTRY
|
The government of the time opted for industry to be India’s prime moving force of the economy.
Given the available resource base it seems an illogical decision as India lacked all those prerequisites which could suggest the declaration of industry as its prime mover – • Almost no presence in the infrastructure sector. • Lack of robust infrastructure industries, i.e., iron and steel, cement, coal, crude oil, oil refining and electricity. • Lack of availability of investible capital – either by the government or the private sector. • Absence of required technology to support the process of industrialisation and lack of research and development. • Lack of skilled and semi-skilled manpower. • Lack of entrepreneurship spirit among the people. • Lack of a market for industrial goods. • Many other socio-psychological factors which acted as negative forces for the proper industrialisation of the economy. • The obvious choice for India would have been the agriculture sector as the prime moving force of the economy because: • The country was having the natural resource of fertile land which was fit for cultivation. • Human capital did not require any kind of higher training. • Higher population in rural areas with involvement in agriculture • Just by organising our land ownership, irrigation and other inputs to agriculture, India could have gone for better prospects of development. • Once the masses were able to achieve a level of purchasing capacity through remunerative income from agriculture, India could have gone for the expansion of industries. • Following developments were in favour of industrialisation – • By choosing industry as the prime moving force, India opted to industrialise the economy as well as modernise the traditional mode of farming. • The dominant ideology around the world as well as in the WB (World Bank) and the IMF (International Monetary Fund) was in favour of industrialisation as a means to faster growth and development. • The Second World War had proved the supremacy of defence power – which needs support not just of science and technology, but also of a robust industrial base. • India also required a powerful defence base for herself as a deterrent force. By the time of independence, the might of industrialisation was already proven and there were no doubts regarding its efficacy. A major shift took place in the Indian economic landscape, when the government announced in 2002 that from now onwards, in place of industry, agriculture will be the prime moving force of the economy. • According to the Planning Commission such a policy shift will solve the following major challenges faced by the economy: 1. Economy will be able to achieve food security with the increase in agricultural production. 2. The agricultural surplus will generate exports in the globalising world economy benefiting out of the WTO (World Trade Organisation) regime. 3. The challenge of poverty alleviation will be solved to a great extent as the emphasis will make agriculture a remunerative occupation and induce growth in the rural economy by generating more gainful employment. 4. The situation of India as an example of ‘market failure’ will cease.
|
| 10 | PLANNED AND MIXED ECONOMY FOR INDIA
|
Post-independence, India was declared to be a planned and a mixed economy.
India was not only facing regional disparities at the level of resources, but inter-regional disparities were also prevalent, since centuries. Deeply entrenched mass poverty could only be remedied once the government started the process of economic planning. The abject poverty of the masses made the government go for planning so that it could play an active role in the allocation of resources and mobilise them for equitable growth and development. Although, constitutionally India was declared a federation of states, but in the process of planning, the authority of regulation, directing and undertaking economic activities got more and more centralised in the Union government. Following factors made pressing points to opt for planned and mixed economy – Great Depression (1929) and the reconstruction challenges after the second world War favoured a state intervention in the economy In the 1950s and 1960s, the dominant view among policymakers around the world was in favour of an active role of the state in the economy – Soviet Union and the East European countries were notable examples. A dominant role of the State in the economy to neutralise market failure situations The dominant force behind planning in India, was Nehru himself who had strong socialist leanings. |
| 11 | Why Emphasis on Public Sector? | The state was to be given an active and dominant role in the economy; it was very much decided by the time India became independent.
Naturally, there was going to be a giant structure of the government-controlled enterprises to be known as the PSUs. The reason behind the ambitious expansion of the PSUs was in the face of the following major requirements: Infrastructural Needs Industrial Needs Employment Generation Development of the Social Sector Emergence of the Private Sector
|
| 12 | Nehru-Mahalnobis Model for Growth | The turning point in India’s planning strategy came with the second five-year (1956- 61) plan.
The model adopted for the plan is known as the Nehru-Mahalanobis strategy of development as it was articulated by Jawahar Lal Nehru’s vision and P.C. Mahalnobis was its chief architect. The Mahalanobis model of growth was based on the predominance of the basic goods (Capital goods or investment goods that are used to make further goods). It was based on the premise that it would attract all round investment and result in a higher rate of growth of output. That will develop a small scale and ancillary industry to boost employment generation, poverty alleviation, exports etc. Other elements of the model were – Import substitution – Protective barriers against foreign competition to enable Indian companies to develop domestically produced alternatives for imported goods. A sizable public sector active in vital areas of the economy including atomic energy and rail transport. A vibrant small-scale sector driving consumer goods production for dispersed and equitable growth and producing entrepreneurs.
Outcomes of the model – In terms of the core objective of rising up the rate of growth of industrial production, the strategy was successful.
Rate of growth of overall industrial production picked up. The strategy laid the foundation for a well- diversified industrial structure within a reasonably short period and this was a major achievement. It gave the base for self-reliance.
Criticism – Visible imbalances between the growth of the heavy industry sector and other spheres like agriculture and consumer goods etc. It heavily relied on trickle-down effect benefits of growth will flow to all sections in course of time. Eradication of poverty is slow and incremental |
| 13 | Rao – Manmohan Singh model of growth | Economic reforms since 1991 are based upon Rao- Manmohan model (Narsimha Rao – PM and Manmohan Singh – Finance minister)
Features of model Selectively dismantle controls and permits in order to permit the private sector to invest liberally. Reorient the role of state in economic management. State should refocus on social and infrastructural development. External sector liberalization in order to integrate the Indian economy with the global economy to benefit from the resource flow and competition. Open up the economy and create competition for PSEs – for better profitability, productivity and efficiency. Forex reserves accumulation thus alleviating the BoP pressures and the foreign flows – FDI and FII increased. Indian economy became competitive. Its success is seen in the more than 6.5% average annual rate of growth of the economy during the 8th Plan (1992-1997) Forex reserves accumulated leaving the BOP crisis in history; taming of inflation; and the foreign flows- FDI and FII increased. |
| 14 | Multilevel Planning | By the mid-1960s, the states were given the power to plan, by the Centre, advising them that they should promote planning at the lower levels of the administrative strata.
By the early 1980s, India was a country of multi- level planning (MLP) with the structure and strata of planning as follows: First Strata: Centre-Level Planning: At centre level planning, three types of Central Plans had evolved over the years – Five Year Plans, Twenty- Point Programme and MPLADS (Member of Parliament Local Area Development Scheme) Second Strata: State-Level Planning By the 1960s, the states were planning at the state level with their respective planning bodies, (State Planning Boards) with the respective CMs being their chairman. The plans of the states were for a term of five years and parallel to the concerned Five Year Plans of the Centre. Third Strata: District-Level Planning By the late 1960s all the districts of the states were having their own plans with their respective District Planning Boards with the respective District Magistrate as chairman. Fourth Strata: Block-Level Planning As a part of the district-level planning the block level planning came up which had the District Planning Boards as their nodal body Fifth Strata: Local Level Planning By the early 1980s, plans were being implemented at the local level via the blocks and had the District Planning Boards (DPBs) as the nodal agency.
|
| 15 | Achievements of Planning | National income increased manifold
India became one of the largest and emerging economies in Asia with about 2.7 trillion USD GDP. India has become the fifth-largest economy in 2019, overtaking the United Kingdom and France. India ranks third when GDP is compared in terms of purchasing power parity at $11.33 trillion. Improvement in social indicators – IMR, MMR, Literacy among others. Robust industrial sector – cement, fertilizers, steel, pharma etc. Agriculture growth is also gaining m Whopping rise in FOREX reserves- about 480 bn USD (June 2020) Global leadership of India in the service sector. Considerable expansion of the higher and vocational education sector – Health universities, engineering institutions etc. Poverty dropped to about 20% of the population
|
| 16 | The Member of Parliament Local Area Development Scheme (MPLADS) | MPLADS is the last of the Central Plans. The scheme was launched in 1993 with Rs. 2 crores given to each MP. In April 2011 the corpus was enhanced to Rs. 5 crores while announcing the new guidelines for the scheme. Under this scheme the Members of Parliament recommends some works (i.e. creation of fixed community assets, based on locally felt developmental needs) to the concerned District Magistrate. |
| 17 | Failures of Planning | High rate of unemployment
Quality of outcome from education is dismal Rampant poverty. Gender parity is still steep and widespread R&D is not globally competitive along with poor spending (about 0.6% of GDP) Export growth is not much high. Regional imbalances are clearly visible Low productivity of agriculture sector Half of the children suffer from malnutrition.
|
| 18 | PRE-REFORM PERIOD (PRE 1990s)
|
Achievements
Acceleration of the growth rate – during the first three decades of planning, the growth rate averaged around 3.5 to 4 percent (known as Hindu growth rate – coined by Prof. Raj Krishna) Growth of the agriculture sector – average spending on agriculture and allied sector was around 23-25 percent of plan outlay in each FYP. Multipurpose projects such as Damodar valley, Bhakra Nangal also brought prospects for the agriculture sector. The Green revolution was also brought in. Development of economic infrastructure – development of irrigation projects, hydroelectric projects, thermal power projects and expansion of network of surface transports. Development of heavy capital goods industry base.
Failures Failure to create employment opportunities – India is facing a problem of underemployment and disguised unemployment. Failure to eradicate poverty – more than quarter of the population in India was living below poverty line even after four decades of planning, this speaks about the failure of planning in creating ‘growth for all’. Failure in undertaking land reforms and other institutional reforms in agriculture – productivity of agriculture is dismal. Non remunerative nature of agriculture. Failure in setting up a strong, competitive, diversified industrial base – promotion of capital goods industries by the state led to concentration and inefficiency.
|
| 19 | ECONOMIC REFORMS SINCE 1991
|
The origin of the financial crisis can be traced from the inefficient management of the Indian economy in the 1980s. Government’s expenditure was more than its income.
ECONOMIC CRISIS OF 1980s Government expenditure began to exceed its revenue by such large margins that meeting the expenditure through borrowings became unsustainable. There was a sharp rise in the prices of many essential goods. Imports grew at a very high rate without matching growth of exports. Foreign exchange reserves declined to a level that was not adequate to finance imports for more than two weeks. No sufficient foreign exchange to pay the interest to international lenders. To avert and mitigate the crisis, India approached the International Bank for Reconstruction and Development (IBRD) (World Bank) and the International Monetary Fund (IMF) and received $7 billion as loan to manage the crisis. Measures to avail the loan from IMF and World Bank Liberalisation- Removing restrictions on the Private Sector Privatisation- Reducing the role of the Government in many areas Globalisation-Removing trade restrictions
CONDITIONS OF IMF FOR INDIA Devaluation of the rupee by 22 per cent. Drastic reduction in the peak import tariff from the prevailing level of 130 per cent to 30 per cent. Excise duties to be hiked by 20 percent to neutralize the revenue shortfalls due to the custom cut. All government expenditure to be cut down by 10 per cent, annually. India agreed to the conditionality’s of World Bank and IMF – announced the New Economic Policy (NEP) – which consisted of following economic reforms: Creating a more competitive environment in the economy by removing the barriers to entry and growth of firms; Introduced liberalization with a view to integrate the Indian economy with the world economy; To remove restrictions on FDI as also to free the domestic entrepreneur from the restrictions of Monopolies and Restrictive Trade Practices (MRTP) Act; To unleash the Indian industrial economy from the web of unnecessary bureaucratic controls; To reduce the load of public sector enterprises which have shown a very low rate of return or which were incurring losses over the years.
|
| 20 | REASONS FOR ECONOMIC REFORMS | Rise in Prices – Inflation surged from 6.7% to 16.7%. attributed to rapid increase in money supply.
Rise in Fiscal Deficit – Due to increase in non- development expenditure fiscal deficit of the Government had been increasing. This was accompanied by rise in public debt and resultant interest. Adverse Balance of Payments: When foreign exchange falls short for payment or total imports exceeds total exports, problems of adverse balance of payments arise. Iraq-Kuwait War 1990-91 – This led to rise in petrol prices. The flow of remittances from Gulf countries stopped. Dismal performance of the PSUs – These were not performing well due to political interference and became a big liability for the Government. Fall in Foreign Exchange Reserves – Indians foreign exchange reserve fell to lowest in 1990-91 and it was insufficient to pay for an import bill for 2 weeks (In 1989-90, it declined to Rs. 6252 crores) Balance of Payments of a country is the record of all economic transactions between the residents of the country and the rest of world in a particular period Import cover – measures the number of months of imports that can be covered with foreign exchange reserves (FOREX) available with the central bank of the country.
|
| 21 | ECONOMIC REFORMS IN INDIA | Economic reforms are the process in which a government prescribes a declining role for the state and an expanding role for the private sector in an economy.
Economic reforms started in India in 1991 have been widely termed by experts as gradualist or incremental in nature with characteristic of occasional reversals. Process of economic reforms started in India with the motto and slogan of ‘reforms with human face’. However, it has utterly failed to garner the empathy of the masses i.e., reforms are to benefit all. Countries such as Brazil, Argentina, South Africa, etc. also went for the stop-and-go approach of reforms, unlike India. In these reforms, the governments first decide the sector where reform is needed – then they pin-point the prerequisites, and finally both sets of the reforms are activated simultaneously |
| 22 | REFORM MEASURES | Macroeconomic Stabilization Measures
These include all those economic policies which intend to boost the aggregate demand in the economy – be it domestic or external. For enhancing domestic demand, increasing the purchasing power of the masses is essential, which connotes an emphasis on the creation of gainful and quality employment opportunities. Structural Reform Measures Measures that include all the policy reforms which have been initiated by the government to boost the aggregate supply of goods and services in the economy. It naturally entails unshackling the economy so that it may search for its own potential of enhanced productivity. For the purchasing capacity of the people to be increased, the economy needs increased income, which comes from increased levels of activities.
LPG FRAMEWORK OF THE REFORMS The process of reforms in India had to be completed via a roadmap of three processes – liberalisation privatisation and globalisation (LPG). These three processes specify the characteristics and extent of the reform process India initiated. Liberalisation the direction of reform Privatisation the path of reform Globalisation shows the ultimate goal of the reform.
3.LIBERALIZATION The term “liberalization” in this context implies economic liberalization. This policy connotes that greater freedom is to be given to the entrepreneur of any industry, trade or business and that governmental control on the same be reduced to the minimum. Liberalisation was introduced to put an end to regulations and restrictions and open up various sectors of the economy. Only key issues of welfare and other regulatory mechanisms are left with the state.
Economy liberalization in Indian context includes: Removal of Industrial Licensing and Registration Reducing the quantitative restrictions on imports also reduces import duties. Reduced control on FOREX management both in current and capital accounts. Financial systems reforms Reduction in the level of both personal and corporate taxation. Liberalized rules for FDI and foreign portfolio investment (FPI). Opening of the public-sector domains like power, transport, banking etc to private players. Partial privatization of public sector units. Change in approach towards industrial sickness
|
| 23 | IMPORTANT MEASURES UNDER LIBERALISATION
|
1. Removal of Industrial Licensing:
All industrial licensing was abolished except a shortlist of 18 industries related to security and strategic concerns, social reasons, hazardous chemicals and overriding environmental reasons. Subsequently, all industries except for a small group of five industries (alcohol, cigarettes, hazardous chemicals industrial explosives, electronics, aerospace and drugs and pharmaceuticals), industrial licensing requirements have been done away with. Reservations for the Public sector for defence equipment, atomic energy generation and railway transport. Market mechanism to determine the prices. 2. Financial Sector Reforms: The major aim of financial sector reforms is to reduce the role of RBI from regulator to facilitator of the financial sector. RBI regulates the financial institutions such as commercial banks, investment banks, stock exchange operations and foreign exchange markets. All the banks and other financial institutions in India are regulated through various norms and regulations of the RBI. Financial sector reforms led to the establishment of private sector banks, both Indian as well as foreign. 3. Liberalization of Foreign Investment: Earlier, prior approval was required by foreign companies, now automatic approvals were given for FDI to flow into the country. A high-priority and investment-intensive industries were de-licensed and could now invite up to 100% FDI including sectors such as hotel and tourism, infrastructure, software development, etc. Use of foreign brand name or trademark was permitted for sale of goods. 4. Public Sector Reforms: Greater autonomy was accorded to the PSUs in- order to restrict interference of the government officials and allow their management greater freedom in decision-making. 5. MRTP Act: The Industrial Policy 1991 restructured the Monopolies and Restrictive Trade Practices Act. Regulations relating to concentration of economic power, pre-entry restrictions for setting up new enterprises, expansion of existing businesses, mergers and acquisitions etc. have been abolished. |
| 24 | Effects of liberalization on Indian Economy | India’s annual average growth rate (GDP) from 1990 – 2018 has been 6.7 % which is almost double than the pre-reforms era.
Industrial Growth Rate – The performance of the industrial sector is dismal, barring few exceptional years. Its share in GDP is still at 29% (2017-18). Foreign companies got free access to Indian markets and made domestic products uncompetitive.
|
| 25 | Reasons for poor industrial growth rate
|
Lower productivity in industry than in services within India – predominance of the ‘unorganized’ sector (account for almost two-thirds of industrial employment in India)
Wages in India are low. However, manufacturing in India is more capital-intensive than in comparable countries. One cause of low productivity is poor infrastructural facilities. Transmission and distribution losses in the power sector in India are more than 20 per cent – higher than in any comparable country. State-owned power companies are inefficient and cannot supply electricity round the clock – shortage of electricity. World Bank studies have repeatedly found India to be low in ease of doing business as compared to its counterparts such as China. Labour laws are more complicated and made by both the Centre and the states. India has invested too little in transport infrastructure – resulting in poor connectivity. The rise in twin balance sheets problems in India. Share of Agriculture in domestic Economy has declined about 17% (2017-18). However ,people dependent upon agriculture are still around 47% Economic reform for agricultural development are critical for – Raising living standards, Alleviating poverty, Assuring food security, Generating buoyant market for expansion of industry and services Making substantial contribution to the national economic growth
PRIVATISATION
The policies through which the ‘roll back’ of the state was done included deregulation, privatization and introduction of market reforms in public services. Privatization at that time was used as a process under which the state assets were transferred to the private sector. Another variant of privatization is disinvestment. Disinvestment is de-nationalization of less than 100 per cent ownership transfer from the state to the private sector. If the sale of shares of the state-owned assets has been to the tune of 51 per cent, the ownership is really transferred to the private sector even then it is termed as privatization. In general sense, all the economic policies which directly or indirectly seem to promote the expansion of the private sector or the market (economy) have been termed as the process of privatization.
GLOBALISATION Globalization is termed as ‘an increase in economic integration among nations. For the WTO, the official meaning of globalization is movement of the economies of the world towards “unrestricted cross border movements of goods and services, capital and the labour force”. Globalization is world economic integration through free movement across national borders of: Financial capital represented by investment in capital markets and money markets, Physical capital represented by plant and machinery Technology Labour.
MAINS ELEMENTS OF GLOBALISATION To open the domestic markets for inflow of foreign goods, India reduced customs duties on imports – to only 10% The import licensing has been almost abolished. Tariff barriers have also been eliminated significantly to encourage trade volume to rise in keeping with the World trade Organization (WTO) Foreign Exchange Regulation Act (FERA) was liberalized in 1993 and later Foreign Exchange Management Act (FEMA) 1999 was passed to enable foreign currency transactions. The FDI policy of the GoI encouraged the inflow of fresh foreign capital by allowing 100% foreign equity in certain projects under the automatic route. India signed many agreements with the WTO affirming its commitment to liberalize trade such as TRIPs (Trade Related Intellectual Property Rights), TRIMs (Trade Related Investment Measures) and AOA (Agreement on Agriculture).
EFFECT OF GLOBALIZATION ON INDIAN ECONOMY Positive effects Increase in Foreign Trade – India’s share in the world trade has gone up significantly in post globalization. Increase in Foreign investment – Govt. started encouraging the entry of foreign investment, which resulted in an increase in FDI and FPI. Increase in Foreign Exchange Reserves – foreign exchange reserves of India hovering round US$ 480 billion at end March 2020. Expansion of Market – expanded size of market facilitated Indian business units to expand their business in the whole world – Infosys, TCS, Wipro, Tata Steel etc. Technological Development – technical collaboration of foreign companies enabled the inflow of modern advanced and superior foreign technology in India. Brand Development – Globalization has promoted the use of branded goods. Brand development has led to quality improvement Development of Capital Market – helped in Indian capital market development. How many foreign investors invest in Indian capital market? Increase in Employment – foreign companies are establishing their production and trading units in India. Reduction in brain Drain – many multinational corporations (MNCs) have set up their business units in India which provide attractive salary packages in India itself. Negative Effect Loss of Domestic industries – Because of better quality and low cost of foreign goods, foreign competition has increased in India. Problem of Unemployment – companies are using capital intensive technology, so employment opportunities have reduced. Exploitation of Labour – exploitation of unskilled workers by giving lower wages, contractual long working hours and worse working condition. Increase in Inequalities – small and cottage industries are adversely hit by foreign industries. Bad Effect on Culture and Value System –The vulgar advertisements shown by some MNCs pollute the thinking of the young generation in India.
ADVOCACY OF GLOBALIZATION Globalisation promotes foreign direct investment which in turn facilitates national development. Globalisation helps developing countries to make use of and adapt technologies developed by advanced countries without undertaking heavy expenditures in R&D. Globalisation widens the access of developing countries to export their goods and services to developed countries. Globalisation enables consumers in developing countries to acquire quality consumer goods, especially consumer durables, at relatively much lower prices. Globalisation facilitates faster diffusion of knowledge. It enables developing countries to attain international standards of production and productivity. By reducing tariffs and quantitative restriction, globalisation increases the share of foreign trade as a percentage of GDP.
Conclusively, the proponents of globalisation consider it as the engine of growth, technological advancement, raising levels of productivity, enlarging employment and bringing about poverty reduction with modernisation. |
| 26 | Generation Of Economic Reforms
First Generation (1991-2000)
|
During the launching of economic reforms in 1991, there were no such official announcements. In the coming times, many ‘generations’ of reforms were announced by the governments.
A total of three generations of reforms have been announced till date, while experts have gone to suggest the fourth generation as well launched in the same year. The broad contours of the First Generation of reforms may be seen as follows: First Generation – Reforms from 1991 to 2000 were called by the government as the reforms of the First Generation. It was in the year 2000–01 that the government, for the first time, announced the need for the Second Generation of economic reforms and it was launched in the same year. The broad contours of the First Generation of reforms may be seen as follows: Promotion to Private Sector – Included various important and liberalizing policy decisions – De-reservation and de- licensing of the industries, abolition of the MRTP limit, simplifying environmental laws. Public Sector Reforms – The steps taken to make the PSUs profitable and efficient, more autonomy in decision making, disinvestment, corporatisation, etc. External Sector Reforms – Consisted of policies such as abolishing quantitative restrictions on import, switching to the floating exchange rate, full current account convertibility, reforms in the capital account, permission to foreign investment (direct and indirect), liberal Foreign Exchange Management Act, etc. Financial Sector Reforms – Initiatives were taken up in areas such as banking, capital market, insurance, mutual funds, etc. Tax Reforms – Consisted of all the policy initiatives directed towards simplifying, broad basing, modernising, checking evasion, DTAAs (Double Taxation Avoidance Agreements), etc. |
| 27 | SECOND GENERATION REFORMS (2000-01 ONWARDS)
|
The government launched the second generation of reforms in 2000-01.
The fact is, that the reforms India launched in the early 1990s were not taking place as intended and a need for another set of reforms was felt by the government. These reforms were not only deeper and delicate, but required a higher political will power from the governments. The major components of the reform are as given below: Factor Market Reforms – Considered as the ‘backbone’ for the success of the reform process in India, it consists of dismantling of the Administered Price Mechanism (APM). Now, only kerosene oil and LPG remained under the APM, while petrol, diesel (by March 2014), lubricants have been phased out. Opening the petroleum sector for private investment, cutting down the burden of levy on sugar, etc. Factor Market Reforms are still going on. Public Sector Reforms – especially emphasises on areas like greater functional autonomy, freer leverage to the capital market, international tie-ups and greenfield ventures, disinvestment (strategic), etc. Reforms in Govt. and Public Institutions – Involves conversion of role of the government from the ‘controller’ to the ‘facilitator’ or the administrative reform. Legal Sector Reforms – Although started in the first generation, now it was to be deepened and newer areas were to be included, such as, abolishing outdated and contradictory laws, reforms in the Indian Penal Code (IPC) and Code of Criminal Procedure (CrPC), Labour Laws, Company Laws and enacting suitable legal provisions for new areas like Cyber Law, etc. Reforms in Critical Areas – reforms initiated in the infrastructure sector (power, roads, telecom, energy sector among others), agriculture, agricultural extension, education and healthcare, etc. These areas have been called by the government as ‘critical areas’. Some other important areas were also emphasised: State’s Role in the Reform – All new steps of the reforms were now to be started by the state with the centre playing a supportive role. Fiscal Consolidation – The FRBM Act is passed by the Centre and the Fiscal Responsibility Act (FRAs) is followed by the states to ensure fiscal prudence. Greater Tax Devolution to the States – during the second generation of reforms, we see a visible change in the central policies favouring greater fiscal leverage to the states. Focussing on the Social Sector – especially healthcare and education get increased attention by the government with manifold increases in the budgetary outlay. |
| 28 |
THIRD GENERATION REFORMS
|
Announcement of the third generation of reforms were made on launching of the Tenth Plan (2002– 07) – ‘inclusive growth and development’
This generation of reforms commits to the cause of a fully functional Panchayati Raj Institution (PRIs), so that the benefits of economic reforms, in general, can trickle down to the grassroots. The constitutional arrangements for a decentralised developmental process were already affected by 73rd and 74th amendment, It was agreed in the early 2000s that the government gets convinced of the need of ‘inclusive growth and development’. Till then, the development process had lacked the ‘inclusion’ factor,
|
| 29 | FOURTH GENERATION REFORMS
|
Fourth generation is not an official ‘generation’ of reform in India.
In early 2002, some experts coined this generation of reforms which entail a fully ‘information technology-enabled’ India. They hypothesised a ‘two-way’ connection between the economic reforms and the information technology (IT), with each one reinforcing the other. |