ES_Compilation_Ch1
CHAPTER 1
Rajasthan’s economy has undergone significant transformation over the past decades, with steady growth driven by a shift from an agriculture-based economy to one increasingly reliant on industry and services. As one of India’s largest states, Rajasthan’s economic structure and performance are critical not only to its own development but also to the national economy. The state’s Gross State Domestic Product (GSDP) serves as a primary indicator of its economic health, capturing the value of goods and services produced across key sectors, including agriculture, industry, and services.
This chapter explores Rajasthan’s macroeconomic trends, with a focus on GSDP growth, sectoral contributions, and per capita income, providing insights into the state’s economic trajectory. Special emphasis is placed on the evolving sectoral composition of the economy, with the service sector emerging as a dominant growth driver, while the industrial sector continues to expand, supported by infrastructure development and policy reforms. The agricultural sector, though experiencing a relative decline in its share of GSDP, remains an important part of the economy due to its role in employment and rural livelihoods.
The chapter also delves into the investment landscape, analyzing trends in Gross Fixed Capital Formation (GFCF), and provides an overview of inflationary pressures through Consumer Price Index (CPI) and Wholesale Price Index (WPI) data. By examining these key economic indicators, Chapter 1 offers a comprehensive view of Rajasthan’s economic environment, highlighting both its strengths and challenges as the state continues its journey toward modernization and balanced growth.
- GSDP: Rajasthan’s Economic Growth Analysis
- Rajasthan’s Gross State Domestic Product (GSDP) at current prices for 2023-24 is projected at ₹15.28 lakh crore, reflecting a 12.56% growth rate.
- The state has shown consistent nominal GSDP growth, though slightly lower than the 13.63% growth rate seen in 2022-23. This marginal reduction can be attributed to inflationary effects and sectoral slowdowns, especially in agriculture.
- When compared to India’s nominal GDP growth of 9.6%, Rajasthan has outperformed the national average in recent years.
- Objective Insight: The state contributes approximately 5.17% to India’s overall GDP in 2023-24, up from 4.84% in previous years. This showcases Rajasthan’s growing influence on the national economy.
- Real vs. Nominal GSDP
- At constant prices (2011-12 base year), the real GSDP for 2023-24 is expected to reach ₹8.45 lakh crore, marking an 8.03% growth rate.
- The real GSDP accounts for inflation, thus providing a more accurate picture of actual economic growth in terms of production volume.
- This contrasts with the nominal GSDP, which reflects both the price level and volume changes. The nominal GSDP growth is higher due to inflation, whereas the real growth rate is a better measure of Rajasthan’s economic performance in constant terms.
- Objective Insight: With a Compound Annual Growth Rate (CAGR) of 11.19% over the past five years at current prices, Rajasthan has maintained a steady economic expansion, driven by increased industrial output and service sector growth.
- Sectoral Contributions to GSDP
- The state’s Gross State Value Added (GSVA) highlights the key role played by various sectors:
- Agriculture accounts for 26.72% of GSVA in 2023-24, down slightly from 27.11% in 2011-12. While this sector still commands a large share, its growth rate has slowed to 2.13%.
- This deceleration reflects challenges like unpredictable weather, rural distress, and low productivity growth. However, Rajasthan remains a significant player in livestock and crop production.
- Industry contributes 28.21% to GSVA, growing by 12.43% in 2023-24, representing the fastest-growing sector.
- This growth is primarily due to increased manufacturing, construction, and mining activities. The government’s focus on infrastructure and industrial investments has stimulated growth.
- Services account for 45.07% of GSVA in 2023-24, marking a significant jump from 38.75% in 2011-12.
- The service sector includes trade, hotels, transport, and financial services, and has seen robust growth due to increasing urbanization, tourism, and service exports.
- Objective Insight: The growing dominance of the service sector reflects structural changes in Rajasthan’s economy, with a shift away from agriculture toward more value-added services and industries.
- Agriculture accounts for 26.72% of GSVA in 2023-24, down slightly from 27.11% in 2011-12. While this sector still commands a large share, its growth rate has slowed to 2.13%.
- Net State Domestic Product (NSDP) Analysis
- The Net State Domestic Product (NSDP), which adjusts GSDP for the depreciation of fixed capital assets, reached ₹13.69 lakh crore at current prices in 2023-24. This marks a 12.70% growth rate.
- Depreciation (also referred to as Consumption of Fixed Capital or CFC) is critical to understanding the net income generated by the state’s economy, which more directly impacts living standards.
- At constant prices, the NSDP grew by 8.10%. This consistency with GSDP growth indicates stable investment and asset utilization in the economy.
- Per Capita Income (PCI) and Standard of Living
- Per Capita Income (PCI) for 2023-24 at current prices is projected to be ₹167,964, showing an 11.49% increase over the previous year.
- When adjusted for inflation, the PCI at constant prices stands at ₹90,831, reflecting a 6.94% growth rate.
- This suggests that, despite inflationary pressures, the average income per person has risen significantly, improving the overall standard of living in Rajasthan.
- Objective Insight: Compared to the national per capita income of ₹184,205 (current prices), Rajasthan’s PCI is below the national average but catching up rapidly, narrowing the income gap with the rest of India.
- Gross Fixed Capital Formation (GFCF) and Investment Trends
- GFCF measures the total value of investments in fixed assets like machinery, infrastructure, and buildings. For 2023-24, the GFCF is expected to be ₹399,594 crore, representing 29.43% of GSDP.
- The private sector dominates capital formation, contributing 78.54%, while the public sector’s contribution is 21.46%.
- Objective Insight: Rajasthan has seen a 12.78% growth in GFCF from the previous year, reflecting increasing investment confidence. The construction sector, in particular, has witnessed a surge, driven by infrastructure projects and urban development.
- Price Statistics and Inflation
- Wholesale Price Index (WPI) in Rajasthan saw a modest increase of 0.54% from 2022 to 2023, with slight growth across all categories:
- Primary Articles: Increased by 0.96%.
- Fuel and Power: Increased by 0.39%.
- Manufactured Products: Increased by 0.23%.
- Rajasthan’s Consumer Price Index (CPI) for industrial workers registered notable inflation rates in different cities:
- Alwar: 1.03% increase.
- Bhilwara: 3.86% increase.
- Jaipur: 2.68% increase.
- Nationally, CPI for industrial workers grew by 5.57%, indicating moderate inflationary pressures across key consumption sectors like food, housing, and clothing.
- CPI Variations
- The Consumer Price Index (CPI) reflects inflation faced by consumers:
- Food & Beverages in Bhilwara saw an inflation rate of 7.92%, while in Jaipur it was 7.80%.
- Fuel & Light witnessed a deflation across all centers, indicating a drop in energy costs.
- Objective Insight: Rajasthan’s inflation remains under control, with CPI reflecting typical inflationary pressures from housing, food, and services. A slight deflation in energy prices provides relief to consumers.
Conclusion
Rajasthan’s macroeconomic landscape has experienced sustained growth over the years, with notable sectoral shifts and an increasing contribution from services and industry. Below is an in-depth conclusion based on the data provided in this chapter.
- Steady GSDP Growth amid Challenges
- Rajasthan’s Gross State Domestic Product (GSDP) at current prices is projected to reach ₹15.28 lakh crore in 2023-24, marking a 12.56% growth rate over the previous year. At constant prices (2011-12 base), the real GSDP growth stands at 8.03%.
- Objective Insight: Despite challenges like inflation and global economic uncertainties, Rajasthan has maintained steady growth, driven primarily by investments in infrastructure, industrial output, and a booming service sector.
- Sectoral Composition: The Rise of Services
- The economy is increasingly service-oriented, with the service sector contributing 45.07% to the Gross State Value Added (GSVA) in 2023-24, up from 38.75% in 2011-12.
- Industry contributed 28.21%, and agriculture accounted for 26.72% of GSVA in 2023-24.
- Objective Insight: The shift from agriculture to services and industry reflects a broader structural transformation in the state’s economy. While agriculture continues to employ a large portion of the population, services are becoming the primary growth driver, aligning with national trends.
- Agriculture’s Declining Share
- Agriculture’s share of the state’s economy has decreased from 28.56% in 2011-12 to 26.72% in 2023-24. While agriculture remains important, its reduced contribution signals a gradual transition toward a more diversified economy.
- Objective Insight: The relative decline in agriculture highlights the increasing reliance on industry and services for economic growth, though the sector still plays a pivotal role in providing employment and livelihoods to a large segment of the population.
- Service Sector as a Growth Engine
- The service sector has seen the fastest growth, with an average annual growth rate of 11.26% in 2023-24 at current prices. It includes key areas such as trade, hospitality, transport, and financial services, reflecting growing urbanization, rising consumer demand, and an expanding tourism industry.
- Objective Insight: The service sector’s rapid growth indicates Rajasthan’s increasing integration into the broader national economy, particularly in hospitality and tourism, areas where the state has significant competitive advantages.
- Industrial Growth and Infrastructure Development
- The industrial sector contributed 28.21% of the GSVA in 2023-24, growing at a rate of 12.43%. The sector’s robust growth is fueled by investments in manufacturing, construction, and mining, as well as improvements in infrastructure and industrial policies.
- Objective Insight: Rajasthan’s industrial growth is aligned with the state’s push for industrialization, backed by initiatives such as Make in India and Startup India. The state is positioning itself as a hub for manufacturing and infrastructure development, particularly in sectors like mining, textiles, and cement production.
- Per Capita Income Growth
- Rajasthan’s Per Capita Income (PCI) at current prices is expected to reach ₹167,964 in 2023-24, reflecting a 11.49% increase over the previous year. At constant prices, PCI stands at ₹90,831, with a 6.94% growth.
- Objective Insight: Although Rajasthan’s PCI is still below the national average, the steady growth in income levels signals improving living standards. This growth, driven by rising wages in both the industrial and service sectors, reflects a gradual closing of the income gap with more prosperous states.
- Investment Confidence and Gross Fixed Capital Formation (GFCF)
- Gross Fixed Capital Formation (GFCF), an indicator of investment in fixed assets like infrastructure and machinery, was ₹3.99 lakh crore in 2022-23, accounting for 29.43% of GSDP. Private sector investments made up 78.54% of GFCF, while the public sector contributed 21.46%.
- Objective Insight: The high level of private sector participation in GFCF reflects strong investment confidence in the state’s economic environment. Investments in infrastructure, urban development, and industrial capacity expansion will be crucial for sustained long-term growth.
- Inflation Control and Price Stability
- The Wholesale Price Index (WPI) increased by 0.54% between 2022 and 2023, while the Consumer Price Index (CPI) for industrial workers increased by 5.57% nationally. In Rajasthan, the CPI increase was 6.64% for rural areas and 6.73% for urban areas.
- Objective Insight: Rajasthan has managed to keep inflation in check despite global inflationary pressures. However, rural inflation remains slightly higher, which could be linked to supply chain disruptions and the cost of food in rural areas.
- Net State Domestic Product (NSDP) and Wealth Generation
- The Net State Domestic Product (NSDP) at current prices is projected to be ₹13.69 lakh crore in 2023-24, reflecting 12.70% growth. At constant prices, NSDP is projected at ₹7.41 lakh crore, with 8.10% growth.
- Objective Insight: NSDP growth reflects the wealth generation within the state, adjusted for depreciation of assets. The steady growth of the NSDP indicates sustainable economic development, with a significant portion of economic output being reinvested into the state’s assets.
- Challenges Ahead: Climate Change and Resource Management
- Rajasthan’s economy, particularly the agriculture sector, remains vulnerable to climate change and water scarcity. With a rapidly declining groundwater level, efforts to manage water resources efficiently and mitigate the impact of drought and climate variability are critical.
- Objective Insight: Addressing these challenges will require comprehensive strategies, including rainwater harvesting, sustainable agricultural practices, and water-efficient technologies to ensure that economic growth is not derailed by environmental factors.
Final Thoughts
- Service-Led Growth: The rapid expansion of the service sector positions Rajasthan as a key player in India’s overall economic transformation. Tourism, hospitality, financial services, and transport are driving this shift.
- Industrial Expansion: The state’s growing industrial base, backed by policy support and infrastructure investment, will continue to play a vital role in enhancing economic output and providing employment opportunities.
- Agriculture’s Transition: Though agriculture’s contribution to GSDP is declining, it still remains an important sector for livelihoods. Diversification into livestock and allied activities, combined with better water management, can help sustain its relevance.
- Income Growth: Steady increases in per capita income indicate improving living standards. However, continued efforts are needed to address income disparities between urban and rural areas.
- Investment Confidence: Strong private sector participation in capital formation shows growing confidence in Rajasthan’s economic future, particularly in industrial and infrastructure sectors.
- Inflation Management: Effective inflation control measures have helped maintain price stability, though rural inflation remains a concern. Focus on improving rural supply chains and productivity could ease inflationary pressures.
- Sustainability and Climate Risks: As Rajasthan faces severe climate risks, addressing environmental sustainability through water conservation, climate adaptation, and better resource management is crucial for future economic resilience.
By addressing these structural challenges while leveraging its growing industrial base and service sector, Rajasthan is poised for sustained long-term economic growth. The state’s future depends on balanced development, with continued focus on infrastructure, resource management, and inclusive growth across all sectors.
Chapter 1
Table 1.1

Analytical Summary
Here is an analytical summary based on the table showing the GSDP/GDP of Rajasthan and All India at current prices from 2019-2020 to 2023-2024 (₹Crore):
- Rajasthan GSDP Analysis:
- 2019-20: The GSDP of Rajasthan stood at ₹10,00,032 crore.
- 2020-21: Rajasthan’s GSDP experienced a marginal growth of 1.79%, increasing to ₹10,17,917 crore. This reflects a slowdown compared to the previous year.
- 2021-22: A significant recovery can be seen in 2021-22, with Rajasthan’s GSDP growing by 17.39% to ₹11,94,961 crore. This could indicate recovery post-pandemic or strong growth due to economic revival initiatives.
- 2022-23: The GSDP continues to grow at 13.63%, reaching ₹13,57,851 crore.
- 2023-24: Estimated GSDP for Rajasthan is ₹15,28,385 crore, with a growth rate of 12.56%. Though growth remains robust, it shows a slight deceleration compared to the previous two years.
- All India GDP Analysis:
- 2019-20: The national GDP stood at ₹2,01,03,593 crore.
- 2020-21: India’s GDP contracted by -1.2% to ₹1,98,54,096 crore. This reflects the economic impact of the COVID-19 pandemic.
- 2021-22: A strong recovery occurred in 2021-22 with GDP growing by 18.9%, reaching ₹2,35,97,399 crore.
- 2022-23: India’s GDP continued to grow at 14.2%, reaching ₹2,69,49,646 crore, reflecting a sustained economic expansion.
- 2023-24: The projected GDP for the year is ₹2,95,35,667 crore, with a more moderate growth rate of 9.6%. This reduction in growth may indicate stabilization after the post-pandemic recovery surge.
Key Observations
- Rajasthan’s economic growth has been relatively stable with higher growth rates in 2021-22 and 2022-23, reflecting recovery from the pandemic and stronger regional economic performance.
- India’s GDP saw significant recovery after a contraction in 2020-21, but the growth rate has gradually slowed to 9.6% by 2023-24, indicating a normalization of the economy after the initial rebound.
Key Terms
- GSDP (Gross State Domestic Product): It is the measure of the economic output of a state or region within a country, calculated as the market value of all goods and services produced within the boundaries of that state over a period of time.
- GDP (Gross Domestic Product): It refers to the total market value of all goods and services produced within the country’s borders in a specific period. It reflects the overall economic health of the nation.
- Current Prices: These are prices that reflect the value of goods and services at the prices that prevail in the year in question, without adjusting for inflation.
- Growth Rate (%): The percentage increase (or decrease) in the economic output from one year to the next, reflecting the health and expansion of the economy.
This data presents a positive trend for both Rajasthan and India, with sustained growth rates after the economic disruptions of the pandemic, though the rates are now normalizing.
Figure 1.1

Analytical Summary
The image provided shows a bar graph representing the Gross State Domestic Product (GSDP) of Rajasthan at current prices from 2019-2020 to 2023-2024. The graph illustrates the steady growth of Rajasthan’s economy over this period, with the Compound Annual Growth Rate (CAGR) calculated at 11.19%.
Key Data Points
- 2019-20: GSDP was ₹10,00,032 crore.
- 2020-21: GSDP increased slightly to ₹10,17,917 crore, reflecting a modest growth amid challenging economic conditions.
- 2021-22: GSDP rose significantly to ₹11,94,961 crore, indicating a strong economic recovery and a year of substantial growth.
- 2022-23: Continued growth to ₹13,57,851 crore, showcasing sustained economic expansion.
- 2023-24: The GSDP is projected to reach ₹15,28,385 crore, representing consistent upward momentum in Rajasthan’s economic performance.
Key Observations
- Growth Trend: The GSDP shows a clear upward trend, with a CAGR of 11.19%, which suggests robust economic development over the five-year period. The graph visualizes this sustained growth.
- Pandemic Impact and Recovery: The relatively low growth between 2019-2020 and 2020-2021 (₹10,00,032 crore to ₹10,17,917 crore) could be attributed to the global and national disruptions caused by the COVID-19 pandemic. However, post-2020, the sharp increase in GSDP reflects recovery efforts and economic policies driving growth.
- Projection for 2023-24: The GSDP is projected to reach ₹15,28,385 crore, which shows continued optimism for Rajasthan’s economic growth. The increase from ₹13,57,851 crore in 2022-23 to this figure also suggests that key sectors may be performing well.
Key Term
- CAGR (Compound Annual Growth Rate): This is a useful metric that shows the mean annual growth rate of an investment or the economy over a specified period of time longer than one year. It accounts for the compounding effect of growth over time. Here, a CAGR of 11.19% means that Rajasthan’s economy has grown at an average rate of 11.19% annually from 2019-2020 to 2023-2024.
This visualization reinforces Rajasthan’s consistent economic progress and highlights the stability of its growth trajectory despite challenges faced in earlier years. The CAGR of 11.19% showcases healthy economic growth over the observed period.
Figure 1.2
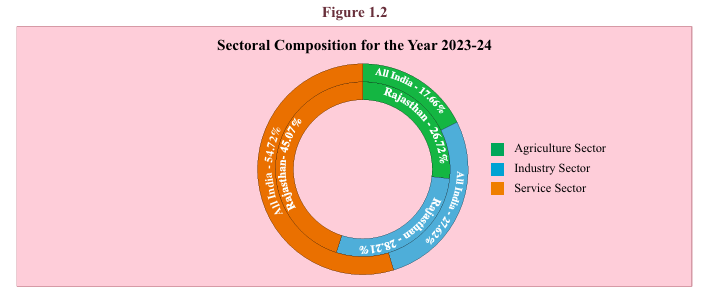
Analytical Summary
The provided image illustrates a sectoral composition chart for Rajasthan and All India in the fiscal year 2023-24. It divides the economy into three major sectors: Agriculture, Industry, and Service.
Key Sectoral Contributions for Rajasthan
- Agriculture Sector:
- Rajasthan: 27.67%
- All India: 17.46%
- Agriculture contributes a significant share of Rajasthan’s GSDP, much higher than the national average. This highlights the agricultural dominance in Rajasthan’s economy, especially relative to the national landscape.
- Industry Sector:
- Rajasthan: 28.21%
- All India: 27.69%
- The Industry sector’s contribution in Rajasthan is marginally higher than the national average, showing a balanced role of manufacturing, construction, and industrial activities in the state’s economy. Rajasthan’s reliance on industries, particularly textiles, mining, and energy, reflects this sectoral strength.
- Service Sector:
- Rajasthan: 44.12%
- All India: 54.85%
- The Service sector in Rajasthan accounts for a smaller proportion of GSDP compared to the national level. Nationally, the service sector is the largest contributor to GDP, but in Rajasthan, it plays a smaller role, indicating a relatively lower presence of service industries compared to other states or the national level.
Key Observations
- Agriculture’s Prominence in Rajasthan:
- Rajasthan’s agriculture sector plays a more prominent role compared to the national economy. With a contribution of 27.67%, Rajasthan’s economy is more reliant on agriculture and allied activities than the national average of 17.46%.
- Balanced Industrial Contribution:
- The industry sector has a similar share in both Rajasthan (28.21%) and All India (27.69%), showing that Rajasthan has a balanced industrial base, with activities ranging from traditional industries like handicrafts and textiles to modern sectors like mining and energy.
- Service Sector’s Lower Share:
- At 44.12%, Rajasthan’s service sector contribution is significantly lower than the national figure of 54.85%. The national economy has seen rapid growth in services like IT, banking, and education, but Rajasthan’s economy is more heavily weighted towards agriculture and industry, reflecting the state’s structural composition.
Sector Definitions
- Agriculture Sector: Includes activities such as farming, livestock, forestry, and fisheries. In Rajasthan, this sector plays a major role due to the state’s large rural population and vast arable land.
- Industry Sector: Comprises manufacturing, mining, construction, and utilities (electricity, water supply). This sector is important for Rajasthan, given its mineral resources and traditional industries.
- Service Sector: Encompasses a broad range of activities such as trade, transport, communication, financial services, real estate, and government services. It tends to dominate in economies that have moved beyond industrial development into more modern services.
Conclusion
The sectoral composition for Rajasthan reveals a traditional economy with a strong reliance on agriculture and a balanced industrial sector. The service sector, while significant, plays a relatively smaller role compared to the national economy. This composition points to opportunities for Rajasthan to potentially expand its service sector while maintaining its strengths in agriculture and industry.
Table 1.2
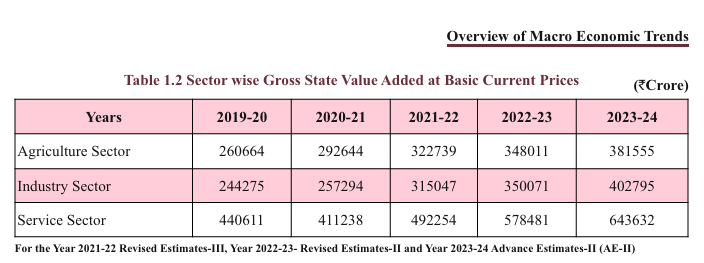
Analytical Summary
The table shows the sector-wise Gross State Value Added (GSVA) for Rajasthan from 2019-20 to 2023-24, covering the Agriculture, Industry, and Service sectors at basic current prices. The values are expressed in ₹ Crore.
Key Data Points by Sector
- Agriculture Sector:
- 2019-20: ₹2,60,664 crore
- 2020-21: ₹2,92,644 crore
- 2021-22: ₹3,22,739 crore
- 2022-23: ₹3,48,011 crore
- 2023-24: ₹3,81,555 crore (estimated)
- The agriculture sector has shown consistent growth year-on-year, with an increase from ₹2,60,664 crore in 2019-20 to an estimated ₹3,81,555 crore in 2023-24, reflecting a robust performance in this sector.
- Industry Sector:
- 2019-20: ₹2,44,275 crore
- 2020-21: ₹2,57,294 crore
- 2021-22: ₹3,15,047 crore
- 2022-23: ₹3,50,071 crore
- 2023-24: ₹4,02,795 crore (estimated)
- The industry sector also shows strong growth, with a notable increase in value from ₹2,44,275 crore in 2019-20 to an estimated ₹4,02,795 crore in 2023-24. The growth from 2021-22 to 2022-23 is particularly significant, indicating a strong post-pandemic recovery in industrial activity.
- Service Sector:
- 2019-20: ₹4,40,611 crore
- 2020-21: ₹4,11,238 crore
- 2021-22: ₹4,92,254 crore
- 2022-23: ₹5,78,481 crore
- 2023-24: ₹6,43,632 crore (estimated)
- The service sector, the largest contributor to Rajasthan’s GSVA, also experienced steady growth. While there was a minor decline in 2020-21 (likely due to the pandemic), the sector quickly recovered and is projected to reach ₹6,43,632 crore in 2023-24.
Key Observations
- Steady Growth Across Sectors:
- All three sectors (Agriculture, Industry, and Services) have shown steady year-on-year growth, with the service sector consistently being the largest contributor to the GSVA, followed by industry and agriculture.
- Post-Pandemic Recovery:
- There was a notable slowdown in growth in the 2020-21 fiscal year, likely due to the economic impact of the COVID-19 pandemic. However, all sectors showed strong recovery starting from 2021-22, with both the industry and service sectors seeing significant growth rates.
- Agriculture’s Solid Performance:
- Agriculture has maintained a steady upward trajectory, showing strong resilience and consistent contributions to Rajasthan’s economy, particularly during the post-pandemic recovery.
- Services Sector Dominance:
- The services sector remains the dominant force in the state’s economy, showing robust growth from ₹4,40,611 crore in 2019-20 to an estimated ₹6,43,632 crore in 2023-24. This indicates a growing importance of sectors such as finance, IT, and trade in Rajasthan’s economic structure.
Key Definitions
- Gross State Value Added (GSVA): GSVA measures the value of goods and services produced in a state by its different sectors. It is a crucial indicator of the economic performance of different sectors (agriculture, industry, and services) at the state level.
- Basic Current Prices: Refers to the prices of goods and services at the time of the transaction, without adjusting for inflation. These prices reflect the market value of production in the present context.
Conclusion
This data suggests that Rajasthan’s economy is well-diversified, with strong contributions from all three sectors. While services dominate, agriculture and industry are also showing substantial growth, indicating a balanced economic structure. The post-pandemic recovery in the industry and service sectors is particularly noteworthy, driving overall growth in the state’s economy.
Table 1.3

Analytical Summary
The table provides an analysis of the Gross State Domestic Product (GSDP) of Rajasthan and the Gross Domestic Product (GDP) of All India at constant 2011-12 prices from 2019-20 to 2023-24, along with the corresponding growth rates for each year.
Key Data Points
- Rajasthan’s GSDP:
- 2019-20: ₹6,78,316 crore
- 2020-21: ₹6,65,963 crore (growth rate: -1.82%)
- 2021-22: ₹7,25,586 crore (growth rate: 8.95%)
- 2022-23: ₹7,82,287 crore (growth rate: 7.81%)
- 2023-24: ₹8,45,115 crore (growth rate: 8.03% – estimated)
- Rajasthan’s GSDP shows a contraction of -1.82% in 2020-21 due to the impact of the COVID-19 pandemic. However, there has been a strong recovery since 2021-22, with a consistent growth trajectory, reaching an estimated 8.03% in 2023-24. The GSDP has increased steadily over the years, with the growth rates reflecting economic resilience and expansion post-pandemic.
- All India GDP:
- 2019-20: ₹1,45,34,641 crore
- 2020-21: ₹1,36,94,869 crore (growth rate: -5.8%)
- 2021-22: ₹1,50,21,846 crore (growth rate: 9.7%)
- 2022-23: ₹1,60,71,429 crore (growth rate: 7.0%)
- 2023-24: ₹1,73,81,722 crore (growth rate: 8.2% – estimated)
- The national GDP also reflects a contraction of -5.8% in 2020-21, a sharper decline compared to Rajasthan. However, a robust recovery followed with growth rates of 9.7% in 2021-22 and an estimated 8.2% in 2023-24. The All India GDP mirrors the global recovery post-pandemic, indicating a return to strong growth trends.
Key Observations
- Pandemic Impact and Recovery:
- Both Rajasthan and India experienced a contraction in 2020-21 due to the economic effects of the COVID-19 pandemic. The negative growth rates for that year reflect the significant disruptions in economic activities. However, Rajasthan’s contraction was less severe than the national contraction (-1.82% vs. -5.8%), indicating relatively better resilience.
- Strong Recovery in Following Years:
- Both Rajasthan and the national economy saw a sharp recovery in 2021-22, with growth rates of 8.95% (Rajasthan) and 9.7% (All India). This suggests that economic recovery efforts, stimulus measures, and the reopening of sectors post-pandemic had a strong positive impact.
- Continued Growth:
- In 2022-23 and 2023-24, the growth rates for both Rajasthan and India remain robust, showing steady economic expansion. Rajasthan’s projected growth of 8.03% in 2023-24 aligns with India’s projected 8.2% growth, suggesting that Rajasthan is on par with national trends in terms of economic performance.
Key Terms
- GSDP (Gross State Domestic Product): Refers to the total economic output of a state, calculated at constant prices (adjusted for inflation to a base year, in this case, 2011-12). It measures the value of goods and services produced within the state’s borders.
- GDP (Gross Domestic Product): Measures the overall economic output of the entire country at constant prices. Like GSDP, it reflects the value of goods and services produced but at a national level.
- Constant Prices (2011-12): Refers to the method of measuring GDP or GSDP by using prices from a base year (2011-12) to remove the effects of inflation and provide a clearer picture of real growth over time.
- Growth Rate (%): The year-on-year percentage change in GSDP/GDP, indicating how much the economy has expanded or contracted compared to the previous year.
Conclusion
The table presents a picture of economic resilience and recovery for both Rajasthan and India, following the contraction caused by the pandemic in 2020-21. The steady growth observed from 2021-22 onwards indicates a return to stable and sustained economic expansion, with Rajasthan showing growth trends largely in line with national performance.
Figure 1.3

Analytical Summary
The graph illustrates the Gross State Domestic Product (GSDP) of Rajasthan at constant 2011-12 prices over the five-year period from 2019-20 to 2023-24, along with the Compound Annual Growth Rate (CAGR) of 5.65%.
Key Data Points (₹ Crore):
- 2019-20: ₹6,78,316 crore
- 2020-21: ₹6,65,963 crore
- 2021-22: ₹7,25,586 crore
- 2022-23: ₹7,82,287 crore
- 2023-24: ₹8,45,115 crore (estimated)
Key Observations
- Steady Growth Over Time:
- The graph shows that the GSDP of Rajasthan has steadily increased over the five-year period, except for a slight dip in 2020-21, which reflects the economic disruption caused by the COVID-19 pandemic. However, a strong recovery is evident from 2021-22 onwards, with consistent growth.
- Pandemic Impact and Recovery:
- The GSDP declined from ₹6,78,316 crore in 2019-20 to ₹6,65,963 crore in 2020-21, indicating a 1.82% contraction. This likely reflects the effects of the pandemic on Rajasthan’s economy. The recovery in 2021-22 (₹7,25,586 crore) and subsequent years shows the resilience of the state’s economy.
- Compound Annual Growth Rate (CAGR):
- The GSDP growth over the five-year period has resulted in a CAGR of 5.65%, indicating moderate but steady economic growth in Rajasthan. This CAGR reflects the average annual growth over the period, accounting for both the contraction in 2020-21 and the subsequent recovery.
- Strong Growth in 2022-23 and 2023-24:
- The GSDP is projected to reach ₹8,45,115 crore in 2023-24, marking a significant rise from ₹7,82,287 crore in 2022-23. This suggests strong economic expansion, driven by recovery across sectors such as industry, agriculture, and services.
Key Term
- CAGR (Compound Annual Growth Rate): A useful measure of the average annual growth rate of an investment or economy over a certain period, accounting for compounding. A CAGR of 5.65% indicates that, on average, Rajasthan’s economy has grown by this rate each year over the five-year period, despite the pandemic-related contraction.
Conclusion
The graph demonstrates steady economic growth for Rajasthan over the period, with a slight dip in 2020-21 due to the pandemic but a robust recovery afterward. The CAGR of 5.65% reflects consistent economic expansion, positioning Rajasthan on a stable growth trajectory moving forward.
Table 1.4
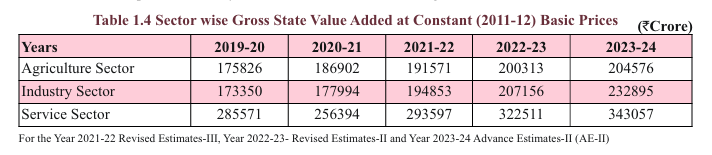
Analytical Summary
The table shows the Sector-wise Gross State Value Added (GSVA) for Rajasthan at constant 2011-12 prices, from 2019-20 to 2023-24, broken down into the Agriculture, Industry, and Service sectors.
Key Data Points (₹ Crore)
- Agriculture Sector:
- 2019-20: ₹1,75,826 crore
- 2020-21: ₹1,86,902 crore
- 2021-22: ₹1,91,571 crore
- 2022-23: ₹2,00,313 crore
- 2023-24: ₹2,04,576 crore (estimated)
- The Agriculture sector has seen steady growth over the years, showing resilience, especially during the pandemic years, with a notable increase from ₹1,75,826 crore in 2019-20 to an estimated ₹2,04,576 crore in 2023-24.
- Industry Sector:
- 2019-20: ₹1,73,350 crore
- 2020-21: ₹1,77,994 crore
- 2021-22: ₹1,94,853 crore
- 2022-23: ₹2,07,156 crore
- 2023-24: ₹2,32,895 crore (estimated)
- The Industry sector also shows steady growth, especially after a slower growth period during 2020-21, likely due to the pandemic. The sector’s growth picked up pace from ₹1,77,994 crore in 2020-21 to an estimated ₹2,32,895 crore in 2023-24.
- Service Sector:
- 2019-20: ₹2,85,571 crore
- 2020-21: ₹2,56,394 crore
- 2021-22: ₹2,93,597 crore
- 2022-23: ₹3,22,511 crore
- 2023-24: ₹3,43,057 crore (estimated)
- The Service sector, the largest contributor to the GSVA, experienced a decline in 2020-21 (₹2,56,394 crore), likely due to pandemic-related restrictions affecting the services economy. However, the sector has bounced back strongly, with a significant rise to ₹3,43,057 crore estimated for 2023-24.
Key Observations
- Agriculture Sector Stability:
- The agriculture sector has shown consistent growth over the years, with its GSVA increasing from ₹1,75,826 crore in 2019-20 to ₹2,04,576 crore in 2023-24. Despite the challenges posed by the pandemic, the sector has shown resilience, with steady year-on-year growth.
- Industry Sector’s Strong Growth Post-Pandemic:
- The industry sector exhibited moderate growth in 2020-21 but rebounded strongly in subsequent years. The projected GSVA for 2023-24 (₹2,32,895 crore) reflects the sector’s recovery and expansion, especially in manufacturing, mining, and construction activities.
- Service Sector’s Fluctuation and Recovery:
- The service sector saw a sharp decline in 2020-21 (down to ₹2,56,394 crore) during the pandemic, which heavily impacted industries like trade, tourism, and financial services. However, the recovery is strong, with GSVA expected to reach ₹3,43,057 crore in 2023-24, showing the sector’s return to its dominant role in the economy.
Key Terms
- Gross State Value Added (GSVA): Measures the value of goods and services produced within a state by various sectors of the economy. It reflects the contribution of each sector (agriculture, industry, and services) to the state’s economy, excluding taxes and subsidies.
- Constant (2011-12) Basic Prices: Refers to the method of calculating GSVA by using the prices from a base year (2011-12) to account for inflation. This gives a more accurate picture of real growth over time by removing the effects of price changes.
Conclusion
The data shows that Rajasthan’s economy has grown across all sectors, with the service sector remaining the largest contributor. The agriculture sector has been stable, while the industry and service sectors, after facing some pandemic-related disruptions, are showing strong recovery. The growth in the industry sector post-pandemic is particularly noteworthy, and the recovery in the service sector is essential for Rajasthan’s long-term economic stability.
Figure 1.4
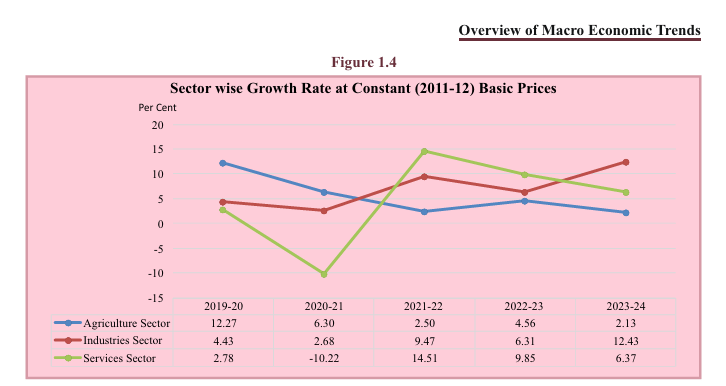
Analytical Summary
This chart presents the sector-wise growth rates at constant (2011-12) prices for the Agriculture, Industry, and Service sectors in Rajasthan from 2019-20 to 2023-24. The growth rates highlight the performance of each sector over time, reflecting the economic fluctuations and recovery patterns.
Key Data Points (Growth Rates in %)
- Agriculture Sector:
- 2019-20: 12.27%
- 2020-21: 6.30%
- 2021-22: 2.50%
- 2022-23: 4.56%
- 2023-24: 2.13% (estimated)
- The agriculture sector had a robust growth rate of 12.27% in 2019-20, but it gradually slowed down to 2.13% in 2023-24. The sector has faced challenges, possibly due to external factors such as changing weather patterns, resource constraints, or pandemic impacts.
- Industry Sector:
- 2019-20: 4.43%
- 2020-21: 2.68%
- 2021-22: 9.47%
- 2022-23: 6.31%
- 2023-24: 12.43% (estimated)
- The industry sector shows a clear recovery trajectory. After a modest growth of 2.68% in 2020-21 (during the pandemic), the sector rebounded strongly with 9.47% growth in 2021-22 and is projected to continue this positive trend with an estimated growth of 12.43% in 2023-24. This indicates increased industrial activity and production post-pandemic.
- Service Sector:
- 2019-20: 2.78%
- 2020-21: -10.22%
- 2021-22: 14.51%
- 2022-23: 9.85%
- 2023-24: 6.37% (estimated)
- The service sector was severely impacted by the pandemic, reflected in the sharp -10.22% contraction in 2020-21. However, it saw a strong recovery in 2021-22 with a growth rate of 14.51%. While growth slowed slightly in 2022-23 and is projected to moderate further to 6.37% in 2023-24, the sector has bounced back significantly from the pandemic lows.
Key Observations
- Pandemic Impact:
- The Service sector was hit hardest during the pandemic, with a -10.22% contraction in 2020-21. This is likely due to the lockdowns and restrictions that heavily impacted sectors like trade, tourism, hospitality, and financial services. However, the sharp recovery in subsequent years shows the resilience of the service industry in Rajasthan.
- Agriculture Sector’s Slowing Growth:
- The Agriculture sector, while initially strong in 2019-20 with 12.27% growth, has seen a slowdown over the years, projected to grow by only 2.13% in 2023-24. This reflects the sector’s vulnerability to structural and external challenges such as weather conditions, labor issues, and fluctuating market demands.
- Industry Sector’s Steady Growth:
- The Industry sector exhibited the most consistent growth trend, especially from 2021-22 onwards. The sector’s projected growth of 12.43% in 2023-24 indicates strong recovery, likely due to increased manufacturing, mining, and construction activities, which are key components of Rajasthan’s industrial base.
- Service Sector’s Fluctuations:
- Despite being the hardest hit during the pandemic, the service sector has bounced back with impressive growth in 2021-22 (14.51%), but this growth appears to be stabilizing, with a projected rate of 6.37% for 2023-24.
Key Insights
- Recovery and Resilience: All sectors experienced some degree of contraction or slowed growth due to the pandemic in 2020-21. However, each sector rebounded at different rates, with the industry and service sectors showing the strongest post-pandemic recoveries, while agriculture remained stable but slower in growth.
- Sectoral Growth Balance: While the service sector remains crucial to Rajasthan’s economy, both the agriculture and industry sectors are showing steady growth, indicating that Rajasthan’s economy is becoming more balanced across all sectors.
Conclusion
This data reflects the varying impacts of the pandemic on Rajasthan’s economy, with the service sector experiencing the greatest volatility. The industry’s strong recovery and the service sector’s rebound indicate a positive economic outlook for Rajasthan, while the agriculture sector shows more gradual growth, emphasizing the need for attention to agricultural productivity and sustainability.
Table 1.5
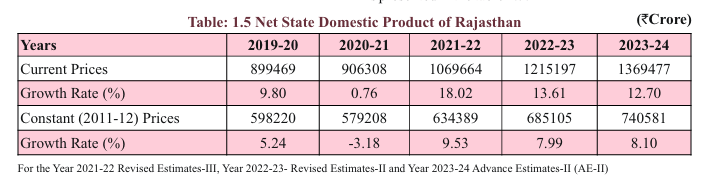
Analytical Summary
This table provides the Net State Domestic Product (NSDP) of Rajasthan for the years 2019-20 to 2023-24, both at current prices and constant (2011-12) prices. It also includes the annual growth rates for each year, which help in understanding Rajasthan’s economic performance over time.
Key Data Points
- NSDP at Current Prices (₹ Crore):
- 2019-20: ₹8,99,469 crore
- 2020-21: ₹9,06,308 crore (growth: 0.76%)
- 2021-22: ₹10,69,664 crore (growth: 18.02%)
- 2022-23: ₹12,15,197 crore (growth: 13.61%)
- 2023-24: ₹13,64,977 crore (growth: 12.70% – estimated)
- After a 0.76% growth in 2020-21, reflecting the pandemic’s impact, Rajasthan’s economy recovered strongly, with significant growth rates of 18.02% in 2021-22 and 13.61% in 2022-23. The projected growth for 2023-24 is slightly lower at 12.70%, reflecting a stabilization of growth as the economy normalizes post-recovery.
- NSDP at Constant (2011-12) Prices (₹ Crore):
- 2019-20: ₹5,98,220 crore
- 2020-21: ₹5,79,208 crore (growth: -3.18%)
- 2021-22: ₹6,34,389 crore (growth: 9.53%)
- 2022-23: ₹6,85,105 crore (growth: 7.99%)
- 2023-24: ₹7,40,581 crore (growth: 8.10% – estimated)
- The constant price data (adjusted for inflation) shows a clearer picture of real economic growth. The 3.18% contraction in 2020-21 highlights the significant economic impact of the pandemic, but the economy has since recovered, with growth stabilizing at around 8% from 2021-22 to 2023-24.
Key Observations
- Pandemic Impact and Recovery:
- The table clearly shows the economic contraction in 2020-21 due to the pandemic, with very low growth at current prices (0.76%) and negative growth at constant prices (-3.18%). This highlights the economic shock caused by the pandemic across sectors in Rajasthan.
- However, the sharp recovery in 2021-22, with growth rates of 18.02% at current prices and 9.53% at constant prices, shows the resilience of Rajasthan’s economy as it rebounded from the pandemic disruptions.
- Growth Stabilization:
- Post-recovery, the growth rates have gradually normalized. While the growth was extraordinarily high in 2021-22 as part of the recovery phase, it slowed slightly to 12.70% (current prices) and 8.10% (constant prices) in 2023-24, reflecting a return to more sustainable levels of economic expansion.
- Inflation-Adjusted Growth:
- The difference between growth at current prices and constant prices reflects inflationary pressures. For instance, the growth rate at current prices for 2023-24 is 12.70%, whereas at constant prices it is 8.10%, indicating inflation-adjusted real growth.
Key Terms
- NSDP (Net State Domestic Product): Represents the total value of goods and services produced within a state, after accounting for depreciation (wear and tear of capital goods). It is an important indicator of the state’s economic health.
- Current Prices: These reflect the actual market prices at the time, without any adjustments for inflation. This shows the nominal growth of the economy.
- Constant Prices (2011-12): These prices are adjusted for inflation using a base year (2011-12), giving a clearer picture of real growth by removing the effect of price changes.
- Growth Rate (%): The percentage change in NSDP from one year to the next, which helps gauge economic expansion or contraction.
Conclusion
This table illustrates the impact of the pandemic on Rajasthan’s economy and its subsequent recovery. After a brief contraction in 2020-21, Rajasthan experienced strong growth in 2021-22, and although growth rates have stabilized since then, the state is still seeing healthy economic expansion in 2022-23 and 2023-24.
Figure 1.5

Analytical Summary
The graph displays the Per Capita Income of Rajasthan and All India at current prices from 2019-20 to 2023-24, along with their respective growth rates. Per capita income is a vital measure to understand the average income of individuals within the state or country, providing insights into the economic well-being of the population.
Key Data Points
- Per Capita Income (₹):
- Rajasthan:
- 2019-20: ₹1,15,534
- 2020-21: ₹1,14,925
- 2021-22: ₹1,34,060
- 2022-23: ₹1,50,653
- 2023-24: ₹1,67,964 (estimated)
- All India:
- 2019-20: ₹1,32,341
- 2020-21: ₹1,27,244
- 2021-22: ₹1,50,996
- 2022-23: ₹1,69,946
- 2023-24: ₹1,84,205 (estimated)
- Rajasthan:
- Growth Rates (%):
- Rajasthan:
- 2019-20: 8.38%
- 2020-21: -0.53%
- 2021-22: 16.65%
- 2022-23: 12.38%
- 2023-24: 11.49% (estimated)
- All India:
- 2019-20: 5.08%
- 2020-21: -3.85%
- 2021-22: 18.60%
- 2022-23: 12.32%
- 2023-24: 8.68% (estimated)
- Rajasthan:
Key Observations
- Pandemic Impact and Recovery:
- Both Rajasthan and All India experienced a contraction in per capita income during 2020-21 due to the economic effects of the COVID-19 pandemic. Rajasthan saw a minor decline of -0.53%, while India faced a larger decline of -3.85%.
- The sharp recovery in 2021-22 with growth rates of 16.65% (Rajasthan) and 18.60% (All India) highlights the economic rebound after the pandemic, driven by recovery measures and the reopening of the economy.
- Rajasthan vs. All India:
- Rajasthan’s per capita income consistently lags behind the national average. In 2019-20, Rajasthan’s per capita income was ₹1,15,534, while All India’s was ₹1,32,341. This gap continues through the years, with the 2023-24 estimates showing Rajasthan at ₹1,67,964 and India at ₹1,84,205.
- Rajasthan’s growth rate tends to closely follow national trends but slightly underperforms compared to India in terms of absolute values of per capita income.
- Strong Growth Post-Pandemic:
- Rajasthan saw a significant recovery after the pandemic, with growth rates of 16.65% in 2021-22 and 12.38% in 2022-23, indicating a sustained economic recovery. The growth rate is projected to stabilize at 11.49% in 2023-24, reflecting continued improvement in economic conditions.
- Growth Stabilization:
- Both Rajasthan and India show stabilization in growth rates by 2023-24. Rajasthan’s growth rate is projected at 11.49%, while India’s is estimated at 8.68%. This suggests that the extraordinary growth seen immediately after the pandemic has normalized, with both regions returning to more sustainable growth levels.
Key Insights
- Per Capita Income Trends:
- While both Rajasthan and India are on a positive growth trajectory, Rajasthan’s per capita income remains lower than the national average. This could indicate structural challenges in the state’s economy, such as lower industrialization or a higher reliance on agriculture, which tends to have lower productivity and wages than other sectors.
- Economic Recovery:
- The steep growth in 2021-22 for both Rajasthan and India signals a strong recovery from the economic disruptions caused by the pandemic. The continued positive growth through 2023-24 points to economic resilience and the effectiveness of recovery policies.
- Relative Underperformance of Rajasthan:
- Despite steady growth, Rajasthan’s lower per capita income compared to the national average may point to inequalities in economic development across states. Efforts to boost industrial and service sector growth could help bridge this gap over time.
Key Terms
- Per Capita Income: The average income earned by each person in a state or country over a specific period, typically calculated by dividing the total income of the region by its population.
- Growth Rate (%): The percentage change in per capita income from one year to the next, which helps gauge the rate at which the economy is growing in terms of income generated per individual.
- Current Prices: Values measured in terms of the current year’s prices, without adjustment for inflation, showing the nominal change in income.
Conclusion
The data shows that both Rajasthan and India experienced a significant economic impact during the pandemic, with negative growth in per capita income in 2020-21. However, the strong recovery in the following years reflects resilience and sustained economic growth, with Rajasthan’s growth following a similar trajectory to the national average but maintaining a lower absolute income level.
Figure 1.6
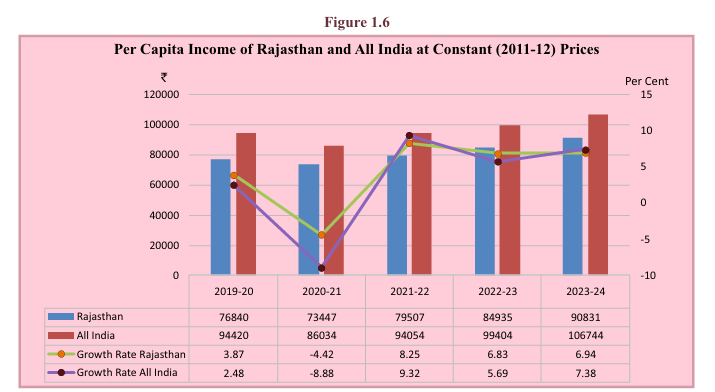
Analytical Summary
This graph illustrates the Per Capita Income of Rajasthan and All India at constant (2011-12) prices from 2019-20 to 2023-24, along with the respective growth rates. This data is adjusted for inflation, providing a clearer picture of real income growth.
Key Data Points (₹)
- Per Capita Income (₹):
- Rajasthan:
- 2019-20: ₹76,840
- 2020-21: ₹73,447
- 2021-22: ₹79,507
- 2022-23: ₹84,935
- 2023-24: ₹90,831 (estimated)
- All India:
- 2019-20: ₹94,420
- 2020-21: ₹86,034
- 2021-22: ₹94,054
- 2022-23: ₹99,404
- 2023-24: ₹1,06,744 (estimated)
- Rajasthan:
- Growth Rates (%):
- Rajasthan:
- 2019-20: 3.87%
- 2020-21: -4.42%
- 2021-22: 8.25%
- 2022-23: 6.83%
- 2023-24: 6.94% (estimated)
- All India:
- 2019-20: 2.48%
- 2020-21: -8.88%
- 2021-22: 9.32%
- 2022-23: 5.69%
- 2023-24: 7.38% (estimated)
- Rajasthan:
Key Observations
- Pandemic Impact and Recovery:
- Both Rajasthan and All India experienced negative growth in 2020-21 due to the economic effects of the COVID-19 pandemic, with Rajasthan seeing a contraction of -4.42% and All India experiencing a steeper decline of -8.88%. This highlights the pandemic’s significant disruption to income levels across the country.
- The recovery phase is evident in 2021-22, where Rajasthan’s per capita income grew by 8.25%, while India’s grew by 9.32%, indicating a strong rebound after the pandemic.
- Rajasthan vs. All India:
- Rajasthan’s per capita income is consistently lower than the national average. For example, in 2023-24, Rajasthan’s estimated per capita income is ₹90,831, while the national average is estimated at ₹1,06,744. This disparity highlights structural differences in the economies of Rajasthan and the nation, such as lower industrialization or higher dependence on agriculture in Rajasthan.
- The growth rates for Rajasthan tend to closely follow national trends but often underperform in comparison to India in terms of absolute per capita income levels.
- Growth Stabilization Post-Recovery:
- After the strong post-pandemic recovery, growth rates are stabilizing for both Rajasthan and India. For 2023-24, Rajasthan is estimated to grow at 6.94%, while India is projected to grow at 7.38%. This suggests that the extraordinary growth seen immediately after the pandemic has normalized, with both economies returning to more sustainable growth patterns.
- Real Income Trends:
- Adjusting for inflation (using constant prices), both Rajasthan and India show positive growth trends in per capita income after 2020-21, indicating real improvements in income levels. However, the persistent gap between Rajasthan and the national average suggests potential areas for improvement in Rajasthan’s economic development, particularly in high-productivity sectors.
Key Insights
- Rajasthan’s Real Income Growth:
- Rajasthan’s per capita income, although growing, remains lower than the national average. This highlights the need for further development efforts, particularly in industrial and service sectors, to boost income levels.
- Pandemic-Induced Fluctuations:
- The negative growth in 2020-21 for both Rajasthan and India highlights the significant economic impact of the pandemic, particularly on individual income levels. However, the recovery in subsequent years demonstrates resilience in both the state and national economies.
- Closing the Gap:
- While both Rajasthan and India have experienced consistent growth in per capita income, Rajasthan’s income levels remain below the national average. Addressing this gap may require strategic investments in infrastructure, education, and industry to enhance productivity and raise income levels.
Key Terms
- Per Capita Income: The average income earned per person in a state or country over a period, calculated by dividing the total income of the region by its population.
- Constant (2011-12) Prices: Values adjusted for inflation to reflect the real growth in income, using 2011-12 as the base year. This provides a clearer picture of purchasing power and economic performance over time.
- Growth Rate (%): The percentage change in per capita income from one year to the next, showing the rate of increase or decrease in average income.
Conclusion
The data shows that both Rajasthan and India have recovered well from the pandemic-induced decline in per capita income, with steady growth in subsequent years. However, Rajasthan’s per capita income continues to lag behind the national average, suggesting that targeted economic interventions are necessary to close this gap and enhance the state’s economic prosperity.
Figure 1.7
Analytical Summary
This chart represents the Gross Fixed Capital Formation (GFCF) for the years 2018-19 to 2022-23, broken down into Private and Public investments. GFCF measures the net increase in physical assets (like infrastructure, buildings, machinery) within an economy and is a key indicator of investment trends.
Key Data Points (₹ Crore)
- Private Investment:
- 2018-19: ₹1,98,583 crore
- 2019-20: ₹2,10,971 crore
- 2020-21: ₹2,05,609 crore
- 2021-22: ₹2,76,046 crore
- 2022-23: ₹3,13,860 crore
- Public Investment:
- 2018-19: ₹66,545 crore
- 2019-20: ₹64,783 crore
- 2020-21: ₹65,067 crore
- 2021-22: ₹78,279 crore
- 2022-23: ₹85,734 crore
Key Observations
- Private Investment Growth:
- Private sector investment has shown significant growth, particularly in 2021-22 and 2022-23. After a slight dip in 2020-21 (likely due to pandemic-related disruptions), private investment rebounded sharply in 2021-22, increasing to ₹2,76,046 crore, and continued its growth to ₹3,13,860 crore in 2022-23. This indicates renewed business confidence and economic recovery post-pandemic.
- Public Investment Stability:
- Public investment has remained relatively stable, though it saw a notable increase in 2021-22, rising from ₹65,067 crore in 2020-21 to ₹78,279 crore in 2021-22. Public investment further increased to ₹85,734 crore in 2022-23, suggesting a continued focus on infrastructure and government-led projects, potentially as part of stimulus efforts during the recovery phase.
- Post-Pandemic Recovery:
- Both private and public investment declined or stagnated during 2020-21, reflecting the global economic downturn caused by the COVID-19 pandemic. However, the sharp rise in investments in 2021-22 and 2022-23 suggests a strong recovery, with both sectors investing heavily in fixed capital to drive long-term growth.
- Private Sector Dominance:
- The private sector accounts for a significantly larger portion of total GFCF compared to the public sector, consistently contributing over 70% of the total investment each year. This dominance suggests that private companies are the primary drivers of capital formation in the economy, focusing on industrial and service sector expansions.
- Public Sector Investment’s Crucial Role:
- While smaller in absolute terms, the public sector’s investment plays a crucial role, particularly in infrastructure projects like roads, energy, and public utilities. The increasing trend in public investment, particularly in 2021-22 and 2022-23, indicates an active role by the government in boosting capital formation through infrastructure and development projects.
Key Insights
- Investment Trends Reflect Economic Health:
- The sharp rise in GFCF in 2021-22 and 2022-23 highlights the post-pandemic recovery and suggests that both the private and public sectors are heavily investing in long-term assets, which is crucial for sustained economic growth.
- Balanced Growth in Public and Private Investments:
- Both private and public investments are growing, though at different scales. The private sector’s larger role indicates strong business activity, while the government’s rising investments suggest an emphasis on infrastructure development and economic recovery programs.
- Pandemic-Related Impact:
- The slight decline or stagnation in investments during 2020-21 reflects the significant economic challenges posed by the pandemic. However, the strong recovery in subsequent years demonstrates resilience in the economy.
Key Term
- Gross Fixed Capital Formation (GFCF): Refers to the net increase in fixed capital stock in an economy, including investments in physical assets such as machinery, buildings, infrastructure, and equipment. It is a key measure of investment activity, influencing future productive capacity.
Conclusion
The data shows a strong upward trend in both private and public investments, with a noticeable boost in 2021-22 and 2022-23. This surge in GFCF indicates a post-pandemic recovery, with both sectors contributing significantly to long-term economic growth. Private investment remains the dominant force, but public investment plays a crucial role in supporting infrastructure and development projects.
Table 1.6
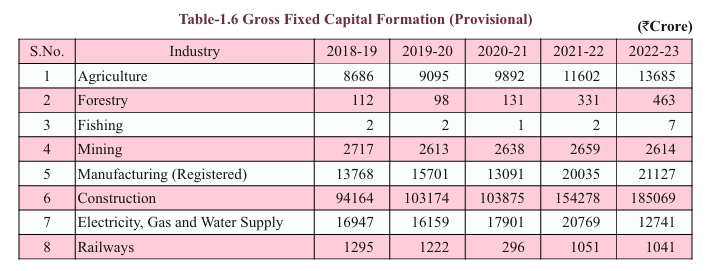
Analytical Summary
This table provides a detailed breakdown of Gross Fixed Capital Formation (GFCF) by industry for the years 2018-19 to 2022-23 (provisional), measured in ₹ Crore. It highlights investment trends across key sectors such as agriculture, manufacturing, construction, and others.
Key Data Points (₹ Crore)
- Agriculture:
- 2018-19: ₹8,686 crore
- 2019-20: ₹9,095 crore
- 2020-21: ₹9,892 crore
- 2021-22: ₹11,602 crore
- 2022-23: ₹13,685 crore
- Investment in the agriculture sector has steadily increased, rising from ₹8,686 crore in 2018-19 to ₹13,685 crore in 2022-23. This reflects a consistent focus on improving agricultural infrastructure.
- Forestry:
- 2018-19: ₹112 crore
- 2019-20: ₹98 crore
- 2020-21: ₹131 crore
- 2021-22: ₹331 crore
- 2022-23: ₹463 crore
- Investment in forestry has grown significantly, especially in 2021-22 and 2022-23, where it saw an increase to ₹463 crore. This reflects increased capital formation in sustainable forest management and related industries.
- Fishing:
- 2018-19 to 2020-21: Minimal investments (₹1-2 crore)
- 2021-22: ₹2 crore
- 2022-23: ₹7 crore
- Investment in the fishing industry remains minimal, although it has slightly increased in recent years.
- Mining:
- 2018-19: ₹2,717 crore
- 2019-20: ₹2,613 crore
- 2020-21: ₹2,638 crore
- 2021-22: ₹2,659 crore
- 2022-23: ₹2,614 crore
- Investment in mining has remained relatively flat over the five-year period, hovering around ₹2,600 crore annually. This suggests stable but limited growth in the mining sector.
- Manufacturing (Registered):
- 2018-19: ₹13,768 crore
- 2019-20: ₹15,701 crore
- 2020-21: ₹13,091 crore
- 2021-22: ₹20,035 crore
- 2022-23: ₹21,127 crore
- Registered manufacturing experienced a dip during the pandemic (2020-21), but rebounded strongly in 2021-22 and 2022-23, with significant growth to ₹21,127 crore in 2022-23, indicating a recovery and renewed investments in the sector.
- Construction:
- 2018-19: ₹94,164 crore
- 2019-20: ₹1,03,174 crore
- 2020-21: ₹1,03,875 crore
- 2021-22: ₹1,54,278 crore
- 2022-23: ₹1,85,069 crore
- The construction sector has seen a significant increase in investments, with GFCF growing from ₹94,164 crore in 2018-19 to ₹1,85,069 crore in 2022-23. This rapid growth highlights the importance of infrastructure development in the state’s economy.
- Electricity, Gas, and Water Supply:
- 2018-19: ₹16,947 crore
- 2019-20: ₹16,159 crore
- 2020-21: ₹17,901 crore
- 2021-22: ₹20,769 crore
- 2022-23: ₹12,741 crore
- Investment in the electricity, gas, and water supply sector peaked at ₹20,769 crore in 2021-22 before dropping to ₹12,741 crore in 2022-23, indicating a potential shift in focus or completion of large infrastructure projects.
- Railways:
- 2018-19: ₹1,295 crore
- 2019-20: ₹1,222 crore
- 2020-21: ₹296 crore
- 2021-22: ₹1,051 crore
- 2022-23: ₹1,041 crore
- Investment in the railways sector fluctuated, with a sharp decline in 2020-21, followed by a recovery in 2021-22 and stability in 2022-23. Despite this, railways remain a smaller component of overall capital formation.
Key Observations
- Growth in Construction Sector:
- The construction industry has seen significant growth in investment, becoming the largest contributor to GFCF in 2022-23, with ₹1,85,069 crore. This reflects major infrastructure projects, including roads, buildings, and urban development.
- Recovery in Manufacturing:
- Manufacturing, which faced a slowdown during the pandemic, saw a strong rebound in 2021-22 and 2022-23. This indicates renewed industrial activity and confidence in the sector, driven by government incentives and economic recovery efforts.
- Public Utilities (Electricity, Gas, Water Supply):
- Investments in utilities grew until 2021-22 but saw a significant decline in 2022-23, potentially due to the completion of major projects or reallocation of resources to other sectors like construction.
- Stable Mining Sector:
- The mining sector’s investment has remained flat over the five-year period. This may reflect regulatory challenges or a lack of expansion in this sector.
- Low Investments in Forestry, Fishing, and Railways:
- These sectors, while showing minor growth, receive minimal investments compared to industries like construction and manufacturing, indicating that these sectors are not major drivers of capital formation in the state.
Key Insights
- Construction and Infrastructure Drive Capital Formation:
- The sharp increase in investments in the construction sector reflects the focus on infrastructure development as a key driver of economic growth. This includes both public and private sector projects.
- Manufacturing Resurgence:
- After a dip during the pandemic, the manufacturing sector is recovering strongly, with investment levels reaching new highs in 2022-23. This indicates increased production capacity and industrial expansion in the state.
- Electricity and Utilities Shift:
- The decline in GFCF in the electricity, gas, and water supply sector in 2022-23 suggests a shift in investment priorities, possibly towards sectors like construction and manufacturing that are witnessing rapid growth.
Key Term
- Gross Fixed Capital Formation (GFCF): A measure of the net increase in fixed assets such as buildings, machinery, and infrastructure, representing long-term investments in the economy that contribute to future production capacity.
Conclusion
The data reveals significant investments in construction and manufacturing, which are key drivers of Rajasthan’s economic growth. The focus on infrastructure and industrial recovery post-pandemic is evident from the strong growth in these sectors, while investments in utilities and railways have seen more fluctuations. This reflects the evolving investment priorities of both public and private sectors.
Table – Gross Capital Formation
Analytical Summary
This table shows the Gross Fixed Capital Formation (GFCF) for key industries from 2018-19 to 2022-23, measured in ₹ crore. The industries covered include communication, trade and services, financial services, residential buildings, and public administration.
Key Data Points (₹ Crore):
- Communication:
- 2018-19: ₹17,308 crore
- 2019-20: ₹15,136 crore
- 2020-21: ₹15,002 crore
- 2021-22: ₹15,815 crore
- 2022-23: ₹15,318 crore
- The communication sector has seen relatively stable investments over the five-year period, with a slight decline in 2022-23 to ₹15,318 crore from a peak of ₹17,308 crore in 2018-19.
- Manufacturing (Unregistered), Trade, Hotels, Restaurant, Transport, and Other Services:
- 2018-19: ₹10,451 crore
- 2019-20: ₹10,902 crore
- 2020-21: ₹10,503 crore
- 2021-22: ₹12,857 crore
- 2022-23: ₹15,045 crore
- Investment in this broad sector has grown steadily, especially after the pandemic. There was a moderate increase in 2021-22 and 2022-23, suggesting recovery and expansion in trade, hotels, and transport services.
- Financial Services:
- 2018-19: ₹1,415 crore
- 2019-20: ₹1,731 crore
- 2020-21: ₹1,322 crore
- 2021-22: ₹1,489 crore
- 2022-23: ₹1,514 crore
- The financial services sector saw a decline during the pandemic year (2020-21), but it has shown a steady recovery since then, with a marginal increase to ₹1,514 crore in 2022-23.
- Residential Building:
- 2018-19: ₹63,322 crore
- 2019-20: ₹66,405 crore
- 2020-21: ₹62,869 crore
- 2021-22: ₹73,474 crore
- 2022-23: ₹79,856 crore
- Residential building investments dipped slightly during the pandemic but rebounded strongly in 2021-22 and 2022-23. The sector saw significant growth in the post-pandemic years, reflecting strong demand for housing.
- Public Administration:
- 2018-19: ₹34,942 crore
- 2019-20: ₹33,518 crore
- 2020-21: ₹33,157 crore
- 2021-22: ₹39,964 crore
- 2022-23: ₹51,114 crore
- Public administration investments have grown substantially, particularly in 2021-22 and 2022-23. The sharp increase to ₹51,114 crore in 2022-23 highlights increased government spending, likely tied to infrastructure development and public services.
- Total GFCF:
- 2018-19: ₹2,65,128 crore
- 2019-20: ₹2,75,755 crore
- 2020-21: ₹2,70,676 crore
- 2021-22: ₹3,54,326 crore
- 2022-23: ₹3,99,594 crore
- Overall, total capital formation has seen strong growth after the pandemic, increasing significantly in 2021-22 and 2022-23, reflecting widespread investments across various sectors.
Key Observations
- Strong Recovery Post-Pandemic:
- Several sectors, including residential building, manufacturing, trade, and public administration, saw a dip during the pandemic year of 2020-21. However, these sectors rebounded strongly in 2021-22 and 2022-23, indicating a recovery in demand and investments.
- Residential Building Growth:
- Investments in residential buildings saw strong growth post-pandemic, reaching ₹79,856 crore in 2022-23. This reflects a housing boom driven by demand for residential properties, government housing schemes, and urban development.
- Public Administration Investments:
- The significant rise in public administration spending from ₹33,157 crore in 2020-21 to ₹51,114 crore in 2022-23 highlights increased government investment in public infrastructure, social services, and administrative services, likely as part of broader recovery programs.
- Stable Financial Services Investment:
- Investments in financial services remain relatively low and stable compared to other sectors. However, the sector has shown signs of recovery since the pandemic and may be an area for future growth.
- Trade, Hospitality, and Transport Recovery:
- The unregistered manufacturing, trade, hotels, restaurants, and transport sector also showed steady growth, with investments increasing from ₹10,503 crore in 2020-21 to ₹15,045 crore in 2022-23. This suggests a revival of consumer demand and business activity in these industries.
Key Insights
- Infrastructure and Public Spending:
- The rise in public administration and residential building investments highlights the government’s role in driving infrastructure projects and housing developments, which are essential for long-term growth and urban development.
- Post-Pandemic Growth:
- The recovery in sectors like trade, hospitality, and manufacturing post-pandemic is crucial for economic stabilization. The continued growth in these sectors reflects renewed business confidence and consumer demand.
- Capital Formation Trends:
- The overall growth in Gross Fixed Capital Formation from ₹2,70,676 crore in 2020-21 to ₹3,99,594 crore in 2022-23 underscores the economy’s resilience and the broad-based nature of investment recovery across different industries.
Key Term:
- Gross Fixed Capital Formation (GFCF): A measure of investment in fixed assets such as infrastructure, buildings, machinery, and equipment. It indicates the economy’s ability to expand productive capacity and support future growth.
Conclusion
The table shows that Rajasthan’s economy is seeing strong post-pandemic recovery, with significant investments in public administration, housing, and key sectors like manufacturing and trade. Government spending, particularly in infrastructure, plays a critical role in driving overall capital formation, while the private sector continues to invest in residential and service industries, fostering economic growth.
Table 1.7

Analytical Summary
This table provides the Wholesale Price Index (WPI) for Rajasthan across various major groups from 2019 to 2023. The WPI reflects the changes in the prices of goods at the wholesale level and is a critical measure of inflation in the economy. The base year for this index is set as 1999-2000 (100).
Key Data Points
- Primary Articles:
- 2019: 317.48
- 2020: 331.49
- 2021: 378.22
- 2022: 416.65
- 2023: 420.67
- Prices of primary articles (including agricultural articles and minerals) have steadily increased, indicating inflationary trends in basic commodities. The index for primary articles has grown by approximately 32.5% over the five-year period.
- Agricultural Articles:
- 2019: 314.89
- 2020: 328.58
- 2021: 377.10
- 2022: 415.64
- 2023: 414.86
- Agricultural article prices have consistently risen, although 2023 shows a slight stabilization compared to 2022.
- Minerals:
- 2019: 337.05
- 2020: 353.47
- 2021: 386.65
- 2022: 424.23
- 2023: 464.56
- The mineral index has seen significant growth, with prices increasing by approximately 37.8% from 2019 to 2023. This could be driven by higher demand for raw materials and global price fluctuations.
- Fuel, Power, Light, and Lubricants:
- 2019: 461.22
- 2020: 509.26
- 2021: 569.93
- 2022: 578.86
- 2023: 579.11
- The index for fuel, power, light, and lubricants has been highly volatile, reflecting global energy price shifts. After peaking in 2021, prices stabilized somewhat in 2022 and 2023, but they remain significantly higher than in previous years.
- Manufactured Products:
- 2019: 256.74
- 2020: 272.27
- 2021: 285.65
- 2022: 302.60
- 2023: 303.29
- Prices for manufactured products have shown a steady increase over the five years, reflecting cost-push inflation due to rising input costs like fuel and raw materials.
- All Commodities:
- 2019: 310.56
- 2020: 330.86
- 2021: 363.23
- 2022: 385.83
- 2023: 387.90
- The overall WPI for all commodities shows steady inflationary pressure, with the index increasing from 310.56 in 2019 to 387.90 in 2023, marking a 24.9% rise over the period.
Key Observations
- Inflationary Pressures in Primary Articles:
- The increase in the WPI for primary articles, particularly minerals and agricultural products, indicates that the cost of essential goods has risen steadily over time. The price of minerals, in particular, has grown faster than agricultural products, suggesting higher demand for raw materials.
- Fuel Price Volatility:
- The fuel, power, light, and lubricants index has been highly volatile, reflecting global energy price fluctuations. Fuel prices spiked in 2021 and have remained high through 2023, impacting transportation, manufacturing, and other sectors reliant on energy inputs.
- Stable Growth in Manufactured Products:
- The index for manufactured products shows a more moderate and consistent increase, reflecting incremental price hikes in goods. This is likely due to the rise in input costs, including raw materials and fuel, passed on to consumers at the wholesale level.
- Overall Inflation:
- The All Commodities WPI shows a steady rise, highlighting general inflation across all sectors. From 2019 to 2023, the index increased by nearly 24.9%, indicating broad-based inflationary pressures across the economy.
Key Insights
- Agriculture and Mineral Price Increases:
- The significant rise in prices of primary articles, particularly in minerals and agricultural products, could have implications for both consumers and producers. Higher input costs could affect profitability for businesses, while increased consumer prices may reduce purchasing power.
- Energy Costs Drive Inflation:
- The volatility in the fuel, power, light, and lubricants sector suggests that energy costs are a major driver of inflation. High energy prices can cascade through the economy, affecting transportation, manufacturing, and service sectors, thereby contributing to overall inflation.
- Inflationary Pressures Persist:
- The rise in the WPI across all categories suggests that Rajasthan is experiencing persistent inflationary pressures, likely driven by supply chain disruptions, rising global commodity prices, and increased demand for raw materials post-pandemic.
Key Term
- Wholesale Price Index (WPI): A measure of the average change in the prices of goods at the wholesale level, reflecting the cost of raw materials and intermediate goods. It serves as a leading indicator of inflation in the economy.
Conclusion:
The data highlights increasing inflationary pressures across various sectors in Rajasthan, particularly in primary articles and energy-related products. The steady rise in the WPI for all commodities indicates that inflation remains a concern, driven by global price trends and rising input costs. The higher cost of energy and raw materials may continue to influence the prices of manufactured goods, affecting overall economic stability.
Table 1.8

Analytical Summary
This table outlines the Annual Average Percent Variations in the Wholesale Price Index (WPI) for various major commodity groups from 2019 to 2023. The table provides year-on-year percentage changes in wholesale prices, reflecting inflationary trends across different sectors.
Key Data Points (% Year-on-Year Change)
- Primary Articles:
- 2019: 6.15%
- 2020: 4.41%
- 2021: 14.10%
- 2022: 10.16%
- 2023: 0.96%
- The primary articles category, which includes agricultural articles and minerals, saw significant price increases in 2021 and 2022, driven by supply chain disruptions and rising global commodity prices. However, the growth rate slowed dramatically in 2023 to just 0.96%, indicating some stabilization.
- Agricultural Articles:
- 2019: 6.43%
- 2020: 4.35%
- 2021: 14.77%
- 2022: 10.22%
- 2023: -0.19%
- Agricultural article prices saw sharp increases in 2021 and 2022, likely due to post-pandemic supply shortages and rising input costs. However, in 2023, prices slightly contracted by -0.19%, signaling that the inflationary pressure in this category has eased.
- Minerals:
- 2019: 4.26%
- 2020: 4.87%
- 2021: 9.39%
- 2022: 9.72%
- 2023: 9.51%
- Mineral prices experienced consistent growth, with inflation rates hovering around 9-10% from 2021 to 2023. This sustained increase reflects strong demand for raw materials, driven by industrial recovery and global market trends.
- Fuel, Power, Light, and Lubricants:
- 2019: -0.55%
- 2020: 10.42%
- 2021: 11.91%
- 2022: 1.22%
- 2023: 0.39%
- Fuel prices saw a sharp increase in 2020 and 2021, driven by global energy price spikes. However, inflation in this category significantly slowed in 2022 and 2023, with minimal growth in 2023 (0.39%), indicating that energy prices have stabilized after the pandemic disruptions.
- Manufactured Products:
- 2019: 3.62%
- 2020: 6.05%
- 2021: 4.91%
- 2022: 5.93%
- 2023: 0.23%
- The manufactured products sector saw steady price increases from 2019 to 2022, likely due to rising input costs such as raw materials and energy. However, inflation in this sector sharply declined to just 0.23% in 2023, indicating that manufacturing costs may have stabilized.
- All Commodities:
- 2019: 3.43%
- 2020: 6.54%
- 2021: 9.78%
- 2022: 6.22%
- 2023: 0.54%
- Overall inflation, measured across all commodity categories, peaked in 2021 with a 9.78% year-on-year increase, reflecting widespread price hikes due to pandemic-related supply chain disruptions and global price surges. However, inflation dropped significantly in 2023 to just 0.54%, indicating that price levels have largely stabilized across sectors.
Key Observations
- Sharp Inflationary Pressures in 2021 and 2022:
- Across all categories, 2021 and 2022 saw significant price increases, particularly in primary articles, agricultural goods, minerals, and fuel. This was likely due to pandemic-induced supply chain issues, rising input costs, and global commodity price spikes.
- Stabilization in 2023:
- The inflationary pressures have eased considerably in 2023, with most categories showing much lower price growth. Agricultural articles even saw a slight contraction in prices, and inflation for manufactured products and fuel slowed to near-zero levels. This suggests that supply chain issues and cost-push inflation have subsided, leading to price stabilization.
- Sustained Inflation in Mineral Prices:
- The price of minerals has consistently grown by around 9-10% each year, reflecting steady demand in industries such as construction and manufacturing. This sector remains a key contributor to overall inflationary trends.
- Fuel Price Volatility:
- The fuel, power, light, and lubricants category saw sharp inflation in 2020 and 2021, but this moderated significantly by 2023. This trend reflects global energy price fluctuations, with recent stabilization indicating improved supply and demand conditions in the energy sector.
Key Insights
- Inflationary Peaks in the Post-Pandemic Period:
- The significant inflation in 2021 and 2022 indicates that the economy experienced sharp cost increases during the recovery from the pandemic. These were likely driven by supply chain constraints, rising global commodity prices, and heightened demand for goods and services.
- Price Stabilization in 2023:
- The data suggests that inflationary pressures have largely eased in 2023, with minimal price increases across most sectors. This reflects a normalization of supply chains and stable demand-supply dynamics in key markets.
- Persistent Inflation in Raw Materials:
- Mineral prices continue to show sustained inflationary trends, driven by strong demand for raw materials in construction and industrial production. This may signal ongoing cost pressures for sectors reliant on minerals.
Key Terms
- Wholesale Price Index (WPI): Measures the average change in the prices of goods at the wholesale level, reflecting price movements for raw materials, intermediate goods, and other commodities.
- Annual Average Percent Variation: The year-on-year percentage change in the WPI, indicating the rate of inflation or deflation in a particular commodity group.
Conclusion
The data highlights significant inflationary pressures in 2021 and 2022, which have eased substantially by 2023. The steep price increases during the recovery from the pandemic were driven by supply chain disruptions and rising input costs across sectors. However, with supply chains normalizing and global price pressures easing, inflation has largely stabilized in 2023, though raw material prices (particularly minerals) remain a source of ongoing inflationary pressure.
Figure 1.8
Analytical Summary
This graph depicts the Wholesale Price Index (WPI) for Rajasthan across key commodity groups from 2019 to 2023. The WPI measures the price levels of goods at the wholesale stage, and the data is indexed with 1999-2000 as the base year (100). The graph presents trends for Primary Articles, Fuel, Power, Light, and Lubricants, Manufactured Products, and All Commodities.
Key Observations from the Graph
- Primary Articles:
- The WPI for Primary Articles (brown line) steadily increased from 2019 to 2022, reflecting rising prices for raw materials, particularly agricultural goods and minerals.
- The index saw the sharpest growth between 2020 and 2021, reflecting post-pandemic supply chain disruptions and high demand for primary commodities. In 2023, growth appears to stabilize, with the index plateauing around 420.
- Fuel, Power, Light, and Lubricants:
- The Fuel, Power, Light, and Lubricants group (blue line) shows the most significant fluctuations, with a sharp increase between 2019 and 2021. This rise corresponds to the surge in global energy prices, driven by supply constraints during the pandemic and post-pandemic recovery.
- The index peaked above 600 in 2022, reflecting the continuing rise in energy prices. By 2023, the index has stabilized, indicating that fuel prices have reached a plateau.
- Manufactured Products:
- The WPI for Manufactured Products (green line) shows steady but moderate growth from 2019 to 2023. This indicates that while the prices of manufactured goods have increased, the rise has been more controlled compared to other groups, such as fuel or primary articles.
- By 2023, the index for manufactured products remains below 400, suggesting relatively stable prices in this category compared to more volatile sectors like fuel.
- All Commodities:
- The WPI for All Commodities (black line with markers) closely follows the trend of primary articles and fuel prices, reflecting their significant influence on the overall price levels. The index shows steady growth from 2019, peaking around 387 in 2023.
- This suggests that while there has been broad-based inflation across sectors, much of it has been driven by fluctuations in primary goods and energy prices.
Key Trends and Insights
- Impact of Fuel Prices:
- The Fuel, Power, Light, and Lubricants category has seen the most volatility and has had a significant impact on overall inflation. The sharp rise in this index between 2020 and 2022 reflects the global energy crisis, with higher fuel costs cascading into other sectors, raising the overall WPI.
- Steady Growth in Primary Articles:
- The consistent rise in the Primary Articles index indicates ongoing inflation in agricultural and mineral prices. The plateauing of the index in 2023 suggests that prices in these sectors may have stabilized following the initial post-pandemic surge.
- Stabilization in Manufactured Products:
- The Manufactured Products category shows the most stable growth pattern, suggesting controlled inflation. This is likely due to manufacturers adjusting input costs and supply chains becoming more efficient post-pandemic.
- General Inflation:
- The trend in the All Commodities index suggests that general inflation across the economy has been moderate, with the exception of sectors influenced by energy prices. By 2023, inflation appears to be stabilizing across all categories, indicating that the economy has absorbed much of the post-pandemic price shocks.
Key Insights
- Energy Price Volatility:
- The sharp rise in fuel and energy prices between 2020 and 2022 indicates how critical these inputs are to overall inflation. Stabilization in this category by 2023 suggests some relief, but continued attention is needed to ensure that energy prices remain stable to prevent further inflationary pressures.
- Inflationary Pressures in Raw Materials:
- The steady rise in the prices of Primary Articles indicates persistent cost pressures for raw materials, especially in agriculture and minerals. This may lead to higher production costs for industries dependent on these inputs.
- Relative Stability in Manufactured Goods:
- The moderate rise in the index for Manufactured Products reflects more stable inflationary conditions for finished goods. This is likely due to improved supply chain efficiency and the ability of producers to manage costs, despite rising input prices.
Key Term
- Wholesale Price Index (WPI): A measure of the price of goods at the wholesale level, tracking changes in the prices of goods before they reach the retail market. The WPI is a key indicator of inflationary trends in the economy.
Conclusion
The graph highlights how different sectors in Rajasthan have experienced varying inflationary pressures from 2019 to 2023. The energy sector, represented by the Fuel, Power, Light, and Lubricants category, has been the most volatile, driving much of the inflationary surge during the post-pandemic recovery. Meanwhile, prices for Primary Articles and Manufactured Products have grown more steadily, with stabilization in 2023 across most categories. This suggests that inflationary pressures have eased, though energy and raw material prices remain key drivers of overall price levels.
Figure 1.9
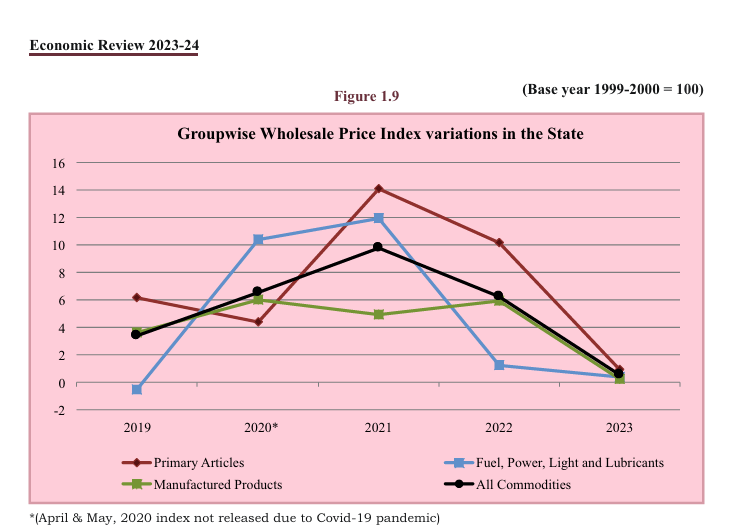
Analytical Summary
This graph shows the Wholesale Price Index (WPI) variations across different commodity groups in Rajasthan from 2019 to 2023. It tracks the percentage changes in prices of Primary Articles, Fuel, Power, Light, and Lubricants, Manufactured Products, and All Commodities (aggregated) based on the base year 1999-2000 = 100.
Key Observations from the Graph
- Primary Articles (Brown Line):
- The Primary Articles category experienced a significant spike in price variation in 2021, reaching a peak of around 14%. This sharp rise was driven by price increases in agricultural products and minerals due to supply chain disruptions and global price surges during the pandemic recovery period.
- After this peak, inflation in primary articles began to decrease in 2022 and continued to fall significantly in 2023, reflecting stabilization in commodity markets.
- Fuel, Power, Light, and Lubricants (Blue Line):
- The price variation in the Fuel, Power, Light, and Lubricants category shows the most dramatic fluctuations. After a drop in 2019 (even dipping below 0), the prices skyrocketed to over 10% inflation in 2020 and 2021 due to the global energy crisis.
- The inflation in fuel-related products dropped significantly by 2022 and 2023, reflecting price corrections in the energy markets as supply issues eased.
- Manufactured Products (Green Line):
- The Manufactured Products category shows much steadier price variations compared to other sectors. The inflation rates hovered around 4-6% between 2019 and 2022, reflecting relatively controlled inflation in this sector.
- By 2023, inflation in manufactured products is very low, approaching 0%, suggesting stable manufacturing costs and reduced inflationary pressure.
- All Commodities (Black Line with Markers):
- The overall WPI for All Commodities follows a similar trend to primary articles and fuel, with significant inflation peaking in 2021 at about 9-10%. This peak reflects general inflationary pressure across all sectors during the post-pandemic recovery.
- Inflation in all commodities decreased sharply in 2022 and 2023, indicating an overall stabilization of prices.
Key Trends and Insights
- Peak Inflation in 2021:
- The graph clearly indicates that 2021 was a year of peak inflation across all major commodity groups, driven by post-pandemic recovery dynamics. Supply chain disruptions, global price increases, and rising demand led to inflationary pressures in primary articles, fuel, and even manufactured products.
- Energy Price Volatility:
- The Fuel, Power, Light, and Lubricants category experienced the most volatile price changes. The sharp rise in fuel prices in 2020 and 2021 reflects the global energy crisis, while the steep drop in 2022 and 2023 suggests that energy markets have stabilized.
- Controlled Inflation in Manufacturing:
- Unlike primary articles and fuel, the Manufactured Products category shows much steadier inflation. The relatively low and stable price variations indicate that the sector was better able to manage cost increases, possibly due to improved supply chains and cost control measures.
- Overall Stabilization in 2023:
- The general WPI for All Commodities shows a sharp decline in price variation by 2023, reaching nearly zero. This indicates that inflationary pressures have largely subsided, and prices have stabilized across the economy, likely due to the resolution of pandemic-related supply chain issues and corrections in global markets.
Key Insights
- Post-Pandemic Inflation:
- The significant inflation in 2021, particularly in primary articles and energy, reflects the economic disruptions and recovery challenges following the COVID-19 pandemic. This period saw rapid price increases due to supply shortages, heightened demand, and global market shocks.
- Energy Price Stabilization:
- The sharp rise and subsequent drop in fuel prices highlights the volatility of energy markets, which have a strong impact on overall inflation. By 2023, energy prices have stabilized, contributing to a broader reduction in inflation across all sectors.
- Moderation of Inflation in 2023:
- The downward trend in price variations for all commodity groups in 2023 suggests that inflation has been brought under control. This may be due to better supply chain management, reduced demand pressures, and lower global commodity prices.
Key Term
- Wholesale Price Index (WPI): A measure of the price changes of goods at the wholesale level. It reflects the inflationary trends for different categories of commodities before they reach the retail market.
Conclusion
The graph shows a clear inflationary peak in 2021 across all commodity groups, driven by post-pandemic recovery challenges. Energy prices were particularly volatile, while inflation in primary articles and manufactured goods was more stable. By 2023, inflationary pressures have eased significantly, with prices stabilizing across all categories, indicating a normalization of market conditions.
Table 1.9
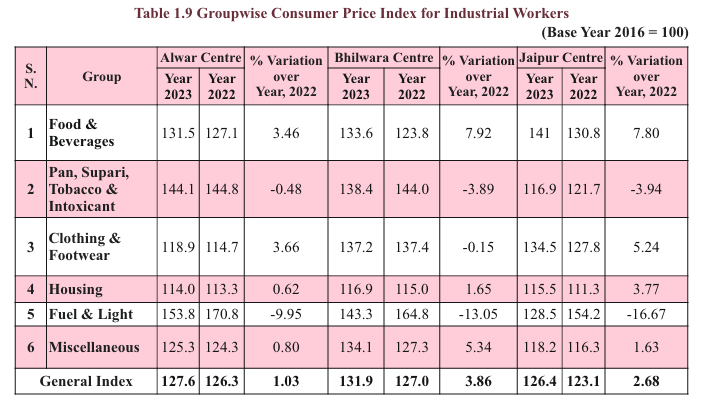
Analytical Summary
This table provides the Consumer Price Index (CPI) for industrial workers across three centers in Rajasthan: Alwar, Bhilwara, and Jaipur. It tracks the CPI for various consumer categories for the year 2023 compared to 2022, showing year-on-year percentage variations. The base year for the index is set as 2016 (base year index = 100).
Key Data Points by Center
- Alwar Centre:
- Food & Beverages: Index increased from 127.1 in 2022 to 131.5 in 2023, representing a 3.46% rise. This reflects moderate inflation in food and beverage costs.
- Pan, Supari, Tobacco & Intoxicants: Index slightly decreased by -0.48%, indicating a stabilization of prices in this category.
- Clothing & Footwear: Prices rose from 114.7 to 118.9, a 3.66% increase, suggesting inflation in clothing and footwear costs.
- Housing: A minimal increase of 0.62%, indicating stable housing costs.
- Fuel & Light: This category saw a significant -9.95% decrease, indicating a reduction in fuel and energy costs in Alwar.
- Miscellaneous: Prices increased marginally by 0.80% in this category.
- General Index: The overall CPI for industrial workers in Alwar rose by 1.03% from 126.3 to 127.6, indicating a relatively stable inflation rate.
- Bhilwara Centre:
- Food & Beverages: The index rose significantly from 123.8 in 2022 to 133.6 in 2023, showing a 7.92% rise, reflecting higher inflation in food and beverages.
- Pan, Supari, Tobacco & Intoxicants: A -3.89% decline in this category suggests a reduction in prices.
- Clothing & Footwear: This category showed no significant change, with the index remaining at 137.2, indicating price stability.
- Housing: Prices increased slightly by 1.65%, suggesting a minor rise in housing costs.
- Fuel & Light: The index saw a substantial -13.05% decrease, suggesting a sharp reduction in energy costs in Bhilwara.
- Miscellaneous: A 5.34% increase was noted, indicating higher costs in other areas like transportation, health, and education.
- General Index: The overall CPI for Bhilwara rose by 3.86%, reflecting moderate inflation across most categories.
- Jaipur Centre:
- Food & Beverages: This category saw a significant increase of 7.80%, with the index rising from 130.8 to 141 in 2023.
- Pan, Supari, Tobacco & Intoxicants: A -3.94% decline in prices was observed.
- Clothing & Footwear: Prices increased by 5.24%, indicating inflation in this category.
- Housing: A 3.77% increase was noted, suggesting moderate inflation in housing costs.
- Fuel & Light: This category saw a substantial -16.67% decrease, marking a sharp decline in fuel and energy costs.
- Miscellaneous: A 1.63% increase was observed in this category.
- General Index: The overall CPI for Jaipur increased by 2.68%, reflecting inflationary trends across various consumer categories, with fuel costs being the major deflationary factor.
Key Observations
- Food & Beverages Inflation:
- The Food & Beverages category saw notable inflation in all three centers, with Bhilwara experiencing the highest increase (7.92%) and Jaipur close behind at 7.80%. This reflects rising food prices across Rajasthan, which could be due to supply chain issues, agricultural production costs, or seasonal factors.
- Fuel & Light Deflation:
- The Fuel & Light category experienced significant price reductions across all centers, with the largest drop in Jaipur (-16.67%) and Bhilwara (-13.05%). This suggests a reduction in energy costs, possibly due to lower global fuel prices or government interventions.
- Housing Stability:
- Housing costs showed only modest increases across all centers, with the highest rise being 3.77% in Jaipur. This indicates relative stability in the housing market compared to other categories, with minimal inflationary pressure.
- Clothing & Footwear Inflation:
- There were moderate increases in Clothing & Footwear prices across the centers, with Jaipur recording the highest inflation at 5.24%. This may reflect rising production or import costs for textiles and clothing.
- General Inflation Trends:
- Overall, the General Index reflects mild to moderate inflation across the three centers, with Bhilwara showing the highest year-on-year rise at 3.86%. Alwar experienced the lowest inflation at 1.03%, indicating more stable prices.
Key Insights
- Food Price Increases:
- The inflation in food and beverages is a key concern, with prices rising sharply in Bhilwara and Jaipur. This could have significant implications for household budgets, particularly for industrial workers who spend a large portion of their income on food.
- Declining Energy Costs:
- The sharp deflation in the Fuel & Light category is a positive sign, suggesting that energy costs are falling. This could provide some relief to households and businesses that depend heavily on fuel and electricity.
- Steady Housing Market:
- The relatively low increases in housing costs suggest that the housing market is stable, with no significant inflationary pressure. This is a positive indicator for affordability in housing for industrial workers.
- Mixed Inflation Across Categories:
- While food and housing prices are increasing, categories like Pan, Supari, Tobacco & Intoxicants and Fuel & Light have seen price reductions. This mixed inflation pattern reflects varying economic forces across different consumer goods.
Key Term
- Consumer Price Index (CPI): A measure that examines the weighted average of prices of a basket of consumer goods and services, such as food, transportation, and housing. The CPI is used to assess price changes associated with the cost of living.
Conclusion
The table shows varying inflation rates across key consumer categories for industrial workers in Rajasthan. Food and housing prices are rising, while fuel costs have seen a notable reduction. Bhilwara is experiencing the highest overall inflation, driven by food prices and miscellaneous costs, while Alwar remains relatively stable. This data provides insight into the cost of living for industrial workers and highlights areas of concern, particularly rising food costs.
Table 1.10
Analytical Summary o
This table shows the Consumer Price Index (CPI) for industrial workers from 2020 to 2023 across three centers in Rajasthan: Alwar, Bhilwara, and Jaipur, along with the national average for All India. The index is based on the year 2016 as the base year (2016 = 100). It also tracks the year-on-year percentage variation for each center and the national average.
Key Data Points
- Alwar Centre:
- 2020 (Sept. to Dec.): Index = 118.1
- 2021: Index = 120.9, a 2.37% increase over 2020.
- 2022: Index = 126.3, a 4.47% increase over 2021.
- 2023: Index = 127.6, a 1.03% increase over 2022.
- Key Insight: Alwar has shown steady inflation between 2020 and 2022, peaking in 2022 with a 4.47% increase, followed by a more moderate 1.03% rise in 2023, indicating stabilization of prices.
- Bhilwara Centre:
- 2020 (Sept. to Dec.): Index = 116.2
- 2021: Index = 118.5, a 1.98% increase over 2020.
- 2022: Index = 127.0, a 7.17% increase over 2021.
- 2023: Index = 131.9, a 3.86% increase over 2022.
- Key Insight: Bhilwara experienced the highest inflation in 2022 with a 7.17% rise in the CPI, reflecting significant price increases in goods and services for industrial workers. The inflation rate moderated to 3.86% in 2023, but Bhilwara remains the center with the highest overall index level at 131.9 in 2023.
- Jaipur Centre:
- 2020 (Sept. to Dec.): Index = 114.3
- 2021: Index = 115.8, a 1.31% increase over 2020.
- 2022: Index = 123.1, a 6.30% increase over 2021.
- 2023: Index = 126.4, a 2.68% increase over 2022.
- Key Insight: Jaipur saw relatively lower inflation in 2021 but experienced a more significant 6.30% rise in 2022. By 2023, the inflation rate had moderated to 2.68%, reflecting more stable prices.
- All India Average:
- 2020 (Sept. to Dec.): Index = 119.1
- 2021: Index = 122.0, a 2.43% increase over 2020.
- 2022: Index = 129.2, a 5.90% increase over 2021.
- 2023: Index = 136.4, a 5.57% increase over 2022.
- Key Insight: Nationally, inflation has been relatively high, with CPI increasing by nearly 6% in both 2022 and 2023, reflecting broad-based inflationary pressures across the country.
Key Observations
- High Inflation in Bhilwara:
- Bhilwara consistently shows the highest inflation rates compared to Alwar and Jaipur, particularly in 2022, when the index increased by 7.17%. This suggests that the cost of living for industrial workers in Bhilwara has risen more sharply than in other regions.
- Price Stabilization in Alwar:
- Alwar saw a significant price rise in 2022, with a 4.47% increase, but inflation has moderated in 2023 to just 1.03%. This suggests that price levels have stabilized in this region after sharp increases in prior years.
- Jaipur Inflation Moderation:
- Jaipur experienced a 6.30% inflation increase in 2022, but the rate slowed to 2.68% in 2023. This trend indicates that while inflation pressures have eased, Jaipur still faces ongoing price increases for industrial workers.
- National Inflation Trends:
- The All India data shows high inflation in 2022 and 2023, with year-on-year increases of nearly 6%. This reflects the broader trend of rising prices across India, driven by factors such as supply chain issues, global price increases, and rising demand post-pandemic.
Key Insights
- Inflation Trends:
- The highest inflation was observed in 2022 across all regions, driven by global economic recovery, increased commodity prices, and supply chain disruptions. The inflation rate moderated in 2023 in most regions, except for the national average, which remained high.
- Regional Variations:
- Bhilwara stands out with the highest CPI in 2023 (131.9), reflecting persistent inflationary pressures. In contrast, Alwar experienced the most stable price conditions with only a 1.03% rise in 2023.
- National Inflation Impact:
- The All India index shows that industrial workers across the country have been affected by rising prices, with inflation levels consistently above 5% in both 2022 and 2023. This indicates broad-based cost-of-living increases for workers in industrial sectors.
Key Term
- Consumer Price Index (CPI): A measure that examines the weighted average of prices of a basket of consumer goods and services, including transportation, food, and medical care. It is used as an indicator of inflation and the cost of living for specific groups, such as industrial workers.
Conclusion
The table reflects varying inflationary pressures for industrial workers in different regions of Rajasthan, with Bhilwara experiencing the highest overall inflation in 2023. Alwar shows more stable prices, while Jaipur continues to experience moderate inflation. Nationally, inflation remains a concern, with prices rising significantly over the past two years. These trends highlight the need to monitor cost-of-living increases and their impact on workers, particularly in high-inflation regions like Bhilwara.
Table 1.11
Analytical Summary o
This table provides the General Consumer Price Index (CPI) for agricultural labourers in Rajasthan and All India from 2019-20 to 2023-24 (with 2023-24 data based on an average of months from July 2023 to May 2024). The CPI is based on the 1986-87 base year (with the index set at 100). The table tracks two indices: the Food Group and the General Index, showing price variations across both food and non-food items for agricultural laborers.
Key Data Points
- Rajasthan:
- Food Group:
- 2019-20: 1058
- 2020-21: 1038
- 2021-22: 1108
- 2022-23: 1247
- 2023-24: 1325 (average for July 2023 to May 2024)
- Insight: The food group CPI for agricultural laborers in Rajasthan shows a consistent rise over time, except for a small decline in 2020-21. The index rose from 1058 in 2019-20 to 1325 in 2023-24, reflecting food price inflation over the period.
- General Index:
- 2019-20: 1083
- 2020-21: 1087
- 2021-22: 1151
- 2022-23: 1260
- 2023-24: 1315 (average for July 2023 to May 2024)
- Insight: The general index, which covers both food and non-food items, shows a steady increase from 1083 in 2019-20 to 1315 in 2023-24. This indicates that the cost of living for agricultural laborers in Rajasthan has risen significantly, with inflation affecting a wide range of goods and services.
- Food Group:
- All India:
- Food Group:
- 2019-20: 955
- 2020-21: 994
- 2021-22: 1026
- 2022-23: 1094
- 2023-24: 1189 (average for July 2023 to May 2024)
- Insight: Nationally, food prices have increased steadily from 955 in 2019-20 to 1189 in 2023-24. The percentage increase is lower than Rajasthan, suggesting that food inflation has been more moderate across India compared to Rajasthan.
- General Index:
- 2019-20: 999
- 2020-21: 1042
- 2021-22: 1092
- 2022-23: 1166
- 2023-24: 1248 (average for July 2023 to May 2024)
- Insight: The general index for All India reflects similar trends, rising from 999 in 2019-20 to 1248 in 2023-24. This shows a consistent upward trend in the cost of living for agricultural laborers across India, but Rajasthan’s inflation appears to be slightly higher.
- Food Group:
Key Observations
- Higher Inflation in Rajasthan:
- The data shows that Rajasthan has experienced higher inflation compared to the national average. The food group index in Rajasthan has risen by 25.2% from 2019-20 to 2023-24, while the national average increased by 24.5%. The general index has risen by 21.4% in Rajasthan, compared to a 24.9% increase at the national level.
- Steady Rise in Food Prices:
- Food prices have consistently risen across both Rajasthan and All India. While the food group index dipped slightly in Rajasthan in 2020-21, it quickly rebounded and saw sharp increases in 2022-23 and 2023-24, reflecting rising food costs for agricultural laborers.
- General Cost of Living:
- The general index for both Rajasthan and All India has shown steady growth, indicating that agricultural laborers are facing increased living costs across a range of goods and services. This is especially notable in 2022-23 and 2023-24, which saw significant jumps in the general index for both Rajasthan and the national average.
- Food Group vs. General Index:
- In both Rajasthan and All India, the food group index has risen faster than the general index, indicating that food prices are a primary driver of inflation for agricultural laborers. This is a critical concern, as food typically constitutes a large portion of expenditure for this demographic.
Key Insights
- Inflationary Pressures on Agricultural Laborers:
- The significant rise in the CPI for both food and general goods indicates that agricultural laborers in Rajasthan, as well as across India, are experiencing substantial inflationary pressures. This could impact their purchasing power, especially since food prices are rising more rapidly than other consumer goods.
- Regional Differences in Inflation:
- Rajasthan has experienced slightly higher inflation than the national average, particularly in food prices. This could be due to regional factors such as agricultural productivity, supply chain issues, or local market dynamics affecting food availability and costs.
- Importance of Food Prices:
- The sharp rise in the food group index highlights the importance of food prices in determining the overall cost of living for agricultural laborers. Policymakers may need to focus on stabilizing food prices to mitigate the impact of inflation on this vulnerable group.
Key Term
- Consumer Price Index (CPI): A measure that examines the weighted average of prices of a basket of consumer goods and services. It is used to track changes in the cost of living over time.
Conclusion
The table highlights rising inflationary pressures on agricultural laborers, with both food prices and the general cost of living increasing significantly in Rajasthan and across India. Rajasthan has seen higher inflation than the national average, especially in food prices, which may have serious implications for the livelihood of agricultural workers. This underscores the importance of policy measures to address food inflation and stabilize costs for essential goods.
Figure 1.10
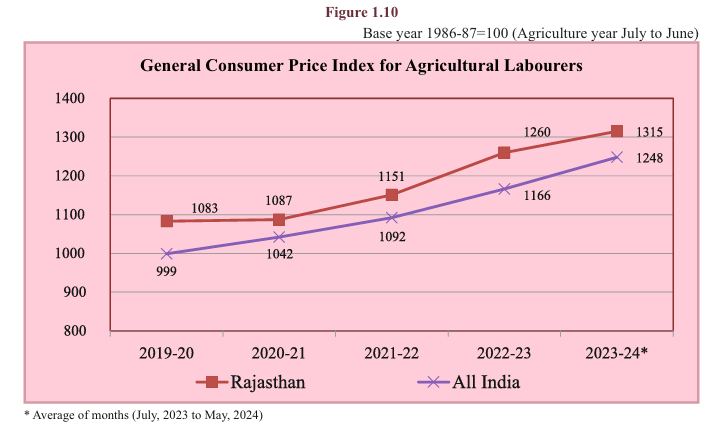
Analytical Summary o
This graph illustrates the General Consumer Price Index (CPI) for Agricultural Labourers in Rajasthan and All India from 2019-20 to 2023-24, based on the 1986-87 base year (index = 100). The graph tracks the overall inflation faced by agricultural laborers in terms of both food and non-food items.
Key Data Points (General CPI Index)
- Rajasthan:
- 2019-20: 1083
- 2020-21: 1087
- 2021-22: 1151
- 2022-23: 1260
- 2023-24: 1315 (average of months July 2023 to May 2024)
- Key Trend: Rajasthan’s CPI for agricultural laborers has risen steadily from 1083 in 2019-20 to 1315 in 2023-24, showing a continuous upward trend, which reflects significant inflationary pressure on the living costs of agricultural workers.
- All India:
- 2019-20: 999
- 2020-21: 1042
- 2021-22: 1092
- 2022-23: 1166
- 2023-24: 1248 (average of months July 2023 to May 2024)
- Key Trend: The national CPI has followed a similar upward trend, rising from 999 in 2019-20 to 1248 in 2023-24. Although the national average is slightly lower than Rajasthan’s, it still reflects a substantial increase in the cost of living for agricultural laborers.
Key Observations
- Steady Inflation in Rajasthan:
- Rajasthan has experienced consistent inflationary growth over the five-year period. The increase from 1083 to 1315 (21.4%) between 2019-20 and 2023-24 shows that agricultural laborers in the state have faced rising costs, likely driven by increases in food prices, essential services, and other necessities.
- National Inflation Trends:
- Nationally, the CPI increased from 999 to 1248 (24.9%) over the same period, reflecting a broad-based increase in living costs for agricultural workers across India. While Rajasthan’s CPI is higher than the national average, the overall trend suggests that agricultural workers throughout India are experiencing rising inflationary pressures.
- Higher Inflation in Rajasthan:
- The gap between Rajasthan’s CPI and the national CPI has widened slightly over time. In 2019-20, Rajasthan’s index was 84 points higher than the national average, and by 2023-24, this difference has increased to 67 points. This suggests that inflation has impacted Rajasthan more intensely than other parts of the country.
- Sharp Increases in Recent Years:
- The most significant CPI increases occurred between 2021-22 and 2022-23 for both Rajasthan and All India. This period likely reflects post-pandemic inflation due to supply chain disruptions, rising food and commodity prices, and broader economic recovery challenges.
Key Insights
- Impact of Inflation on Agricultural Labourers:
- The rising CPI indicates that agricultural laborers are facing significant cost-of-living increases. Since food typically constitutes a large proportion of their expenses, the rising food prices are likely a key contributor to this inflation.
- Rajasthan’s Higher Inflation:
- The fact that Rajasthan consistently has a higher CPI than the national average suggests that regional factors, such as local supply chain constraints, agricultural productivity, or market dynamics, may be driving up costs more acutely in the state compared to other parts of India.
- Need for Inflation Control Measures:
- The consistent upward trend in CPI underscores the importance of policy interventions to control inflation, particularly in essential goods and services, to protect the purchasing power and well-being of agricultural laborers who are vulnerable to price shocks.
Key Term
- Consumer Price Index (CPI): A measure that examines the weighted average of prices of a basket of consumer goods and services, including food, transportation, and healthcare, which is used to track inflation and the cost of living.
Conclusion
The graph highlights the rising inflationary pressures on agricultural laborers in Rajasthan and across India. Both regions have seen steady increases in the CPI, with Rajasthan experiencing slightly higher inflation compared to the national average. The rising cost of living for agricultural laborers, driven primarily by food and essential services, reflects the broader inflationary trends in the economy, underscoring the need for policy measures to mitigate the impact on vulnerable groups.
Table 1.2
Analytical Summary
This table presents the General Consumer Price Index (CPI) for rural, urban, and combined populations in Rajasthan and All India from 2019 to 2023, using the base year 2012 = 100. The CPI tracks changes in the cost of living over time by measuring the average price changes of goods and services consumed by households.
Key Data Points
- Rajasthan:
- Rural:
- 2019: 145.33
- 2020: 153.11
- 2021: 157.85
- 2022: 169.10
- 2023: 180.41
- Insight: The rural CPI in Rajasthan shows a steady increase from 145.33 in 2019 to 180.41 in 2023, indicating rising costs for rural households, with a particularly sharp increase between 2022 and 2023.
- Urban:
- 2019: 144.11
- 2020: 152.38
- 2021: 157.73
- 2022: 167.98
- 2023: 179.10
- Insight: The urban CPI in Rajasthan follows a similar trend, rising steadily from 144.11 in 2019 to 179.10 in 2023. The urban index is slightly lower than the rural index, suggesting that inflationary pressures may be higher in rural areas compared to urban regions.
- Combined:
- 2019: 144.91
- 2020: 152.84
- 2021: 157.81
- 2022: 168.70
- 2023: 179.95
- Insight: The combined CPI for Rajasthan reflects the overall inflationary trends across both rural and urban areas, with a steady rise from 144.91 in 2019 to 179.95 in 2023.
- Rural:
- All India:
- Rural:
- 2019: 144.89
- 2020: 154.54
- 2021: 161.89
- 2022: 173.13
- 2023: 183.17
- Insight: The rural CPI for India as a whole shows a similar upward trend, with the index rising from 144.89 in 2019 to 183.17 in 2023. The national rural index is higher than Rajasthan’s in the recent years, indicating higher inflation in rural areas nationwide.
- Urban:
- 2019: 142.82
- 2020: 152.27
- 2021: 160.73
- 2022: 171.03
- 2023: 180.41
- Insight: The urban CPI for India also shows steady growth, with a rise from 142.82 in 2019 to 180.41 in 2023, mirroring Rajasthan’s urban inflation trend. However, the national urban CPI is slightly lower than Rajasthan’s.
- Combined:
- 2019: 143.93
- 2020: 153.47
- 2021: 161.35
- 2022: 172.15
- 2023: 181.88
- Insight: The combined national CPI shows a steady increase from 143.93 in 2019 to 181.88 in 2023, indicating inflationary pressures similar to those in Rajasthan, though the national CPI remains slightly lower.
- Rural:
Key Observations
- Higher Inflation in Rural Rajasthan:
- In Rajasthan, rural areas have experienced higher inflation compared to urban areas, with the rural CPI reaching 180.41 in 2023, compared to the urban CPI of 179.10. This could reflect rising costs in rural commodities, agricultural inputs, and essential goods.
- National Trends Show Similar Inflation:
- The All India data shows similar inflationary trends, with both rural and urban indices rising steadily. However, the national rural CPI is slightly higher than Rajasthan’s in recent years, while the urban index is slightly lower.
- Steady Inflationary Growth:
- Both Rajasthan and All India have seen a steady rise in the CPI from 2019 to 2023, with no significant declines. This reflects consistent inflationary pressure across all regions, likely driven by increased costs of essential goods, services, and agricultural products.
- COVID-19 Impact in 2020:
- The data shows a moderate increase in 2020, despite the economic disruptions caused by the COVID-19 pandemic. The rise in CPI in 2020 may reflect supply chain challenges, increased demand for essential goods, and pandemic-related price adjustments.
Key Insights
- Rural Inflation Pressure:
- The higher CPI in rural Rajasthan suggests that inflation is affecting rural households more severely, possibly due to increased costs of essential goods, agricultural inputs, and transportation. This could lead to greater economic strain on rural populations, who may already have limited financial resources.
- Urban vs. Rural Comparison:
- Both Rajasthan and national trends show that rural areas are experiencing higher inflation than urban areas. This could be due to differences in consumption patterns, with rural households more dependent on agricultural products, which may have seen greater price volatility.
- Long-Term Inflationary Trends:
- The consistent rise in the CPI from 2019 to 2023 suggests that inflation is an ongoing issue, with both rural and urban populations facing rising living costs. Policymakers may need to focus on measures to stabilize prices and control inflation, especially in essential goods and services.
Key Term
- Consumer Price Index (CPI): A measure that tracks the average change in prices of goods and services over time, reflecting inflation and the cost of living for households. The CPI is calculated separately for rural and urban populations to capture the unique price pressures in different areas.
Conclusion
The table highlights the steady rise in inflation for both rural and urban areas in Rajasthan and across India. Rural areas in Rajasthan are experiencing higher inflationary pressure compared to urban areas, while the national trend shows similar inflation across rural and urban regions. The rise in the CPI reflects increased costs of living, particularly for essential goods and services, underscoring the need for inflation control measures to protect vulnerable populations.