
Chapter 10
Chapter 10 focuses on the financial management and resource allocation strategies of Rajasthan, highlighting how the state mobilizes and manages its resources to drive economic growth and development. The chapter examines key fiscal indicators such as revenue receipts, expenditure patterns, fiscal deficits, and debt management, providing insights into the state’s financial health. It also explores the role of externally aided projects (EAPs), Public-Private Partnerships (PPP), and capital investments in supporting infrastructure development and other critical sectors.
The chapter outlines Rajasthan’s efforts to balance its developmental priorities with fiscal discipline, ensuring that public finances are effectively managed to meet the needs of a growing population. With an emphasis on inclusive development, the chapter discusses how the state allocates resources toward key areas like social services, energy, and rural development, while addressing fiscal challenges such as the rising debt burden and deficit levels. Through a combination of internal revenue generation, borrowings, and external aid, Rajasthan aims to achieve its development goals sustainably.
- Fiscal Management
1.1 Revenue Deficit and Fiscal Deficit
- The revenue deficit for Rajasthan in 2022-23 was ₹31,491 crore, slightly lower than the ₹32,310 crore projected in the revised estimates.
- The fiscal deficit for 2022-23 stood at ₹51,029 crore, compared to the revised estimate of ₹61,264 crore. The fiscal deficit was 3.76% of the Gross State Domestic Product (GSDP), which is within the 4.37% permissible limit.
- Objective Insight: While Rajasthan successfully managed to reduce its fiscal and revenue deficits below estimated values, the persistent high deficit levels indicate challenges in balancing state expenditure and revenue generation.
- Revenue Receipts and Expenditure Trends
2.1 Revenue Receipts
- Total revenue receipts increased by 6.02% in 2022-23, with total receipts amounting to ₹1,94,988 crore.
- Growth was driven by a 16.76% increase in own tax revenue, led by sectors such as vehicle tax (28.77%), stamps and registration (26.14%), and State Goods and Services Tax (SGST) (22.87%).
2.2 Expenditure Trends
- Revenue expenditure in 2022-23 amounted to ₹2,26,479 crore, while capital outlay was ₹19,798 crore.
- 79.12% of total expenditure was met from revenue receipts, while the remaining expenditure was met through capital receipts and borrowed funds.
- Expenditure on salary and wages increased by 4.65%, reaching ₹59,774 crore, which constituted 35.06% of total revenue expenditure.
Objective Insight: The growth in revenue receipts was robust, driven by state-level tax collections, indicating an improvement in tax administration. However, the rise in salary and wage expenditures emphasizes the need for better fiscal discipline in managing recurrent costs.
- Debt Management and Fiscal Liabilities
- Rajasthan’s fiscal liabilities increased from ₹4,62,845 crore in 2021-22 to ₹5,05,574 crore in 2022-23, representing a 9.23% growth.
- Debt-to-GSDP ratio stood at 37.23% at the end of 2022-23, with fiscal liabilities representing 259.29% of revenue receipts.
- Objective Insight: Rajasthan’s growing debt burden is a matter of concern, especially with a debt-to-GSDP ratio approaching unsustainable levels. The state needs to focus on debt management strategies to ensure fiscal sustainability in the long term.
- Developmental Expenditure
- Developmental expenditure (including spending on economic and social services) for 2022-23 was ₹1,74,035 crore, accounting for 70.6% of total expenditure.
- A significant portion of this spending was allocated to social services (₹99,019 crore) and economic services (₹75,016 crore).
- Objective Insight: The state’s emphasis on developmental expenditure, particularly in social and economic services, highlights a strong focus on promoting inclusive growth and infrastructure development.
- Schematic Budget and Expenditure
- The Schematic Budget outlay for 2023-24 was ₹1,84,311.57 crore, with the majority allocated to social and community services (52.65%), energy (13.67%), and rural development (10.79%).
- For 2022-23, the state utilized ₹1,48,192 crore of the total schematic budget.
- Objective Insight: Rajasthan’s schematic budget prioritizes key sectors such as energy, social services, and rural development, which are essential for the state’s long-term development and poverty reduction.
- Externally Aided Projects (EAPs)
- Rajasthan leverages externally aided projects (EAPs) from international financial institutions such as the World Bank, Asian Development Bank (ADB), and Japan International Cooperation Agency (JICA) to finance critical infrastructure and social sector projects.
- In 2023-24, Rajasthan had 13 ongoing EAPs with a total expenditure of ₹4,037.09 crore.
- Objective Insight: External aid plays a crucial role in supplementing the state’s financial resources, particularly for infrastructure development. These projects are vital in addressing Rajasthan’s resource constraints and meeting its development goals.
- Public-Private Partnerships (PPP)
- Rajasthan continues to promote Public-Private Partnerships (PPP), particularly in sectors like roads, energy, and urban infrastructure. As of March 2024, 197 PPP projects worth ₹17,790.59 crore were completed.
- Additionally, 28 projects worth ₹4,010.60 crore are under implementation, and 29 projects worth ₹11,508.90 crore are in the pipeline.
- Objective Insight: PPP projects are essential for attracting private sector investment and expertise, enabling the state to meet infrastructure demands without overburdening its budget.
Conclusion
Chapter 10 provides a comprehensive analysis of Rajasthan’s fiscal management, resource allocation, and financial strategies aimed at fostering economic growth and sustainable development. The state’s approach encompasses effective revenue generation, prudent expenditure management, strategic use of external aid, and the promotion of Public-Private Partnerships (PPPs). Below are the elaborate conclusions and key insights derived from the chapter:
- Effective Revenue Generation
- Robust Growth in Revenue Receipts:
- 16.76% Increase in Own Tax Revenue: Significant growth driven by vehicle tax (28.77%), stamps and registration (26.14%), State GST (22.87%), state excise (12.86%), and sales tax (10.30%).
- Enhanced Tax Administration: Improved compliance and efficient tax collection mechanisms have strengthened the state’s fiscal base.
- Non-Tax Revenue and Central Shares:
- Increase in Non-Tax Revenue: Growth in non-tax revenue, including share in central taxes and union grants, contributed to overall revenue growth.
- Strategic Central Grants: Effective utilization of central grants has supported various developmental initiatives.
- Key Insight: Rajasthan’s focused efforts on expanding its own tax base and optimizing non-tax revenue streams have significantly bolstered its revenue receipts, providing a stable foundation for funding public expenditures and development projects.
- Expenditure Management
- Balanced Revenue and Capital Expenditure:
- Revenue Expenditure: Increased to ₹2,26,479 crore in 2022-23, primarily driven by higher spending on salaries and wages.
- Capital Outlay: Maintained at ₹19,798 crore, indicating continued investment in infrastructure and development projects.
- Controlled Growth in Recurrent Costs:
- Salary and Wages: Expenditure on salaries and wages constitutes 35.06% of total revenue expenditure, with a controlled growth rate of 4.65%.
- Interest Payments: Managed at 15.69% of revenue receipts, reflecting efforts to keep debt servicing within manageable limits.
- Key Insight: Rajasthan has effectively managed its expenditure by balancing recurrent and capital expenses, ensuring that a significant portion of the budget is directed towards developmental activities while maintaining control over operational costs.
- Fiscal Deficit and Debt Management
- Reduction in Fiscal Deficit:
- Fiscal Deficit Ratio: Reduced to 3.76% of GSDP in 2022-23, well within the permissible limit of 4.37% as per the FRBM Act, 2005.
- Revenue Deficit: Managed to decrease slightly, indicating improved fiscal discipline.
- Rising Fiscal Liabilities:
- Total Fiscal Liabilities: Increased by 9.23% to ₹5,05,574 crore in 2022-23.
- Debt-to-GSDP Ratio: Stood at 37.23%, highlighting growing debt levels despite deficit reduction.
- Key Insight: While Rajasthan has made commendable progress in reducing its fiscal deficit, the increasing fiscal liabilities and debt-to-GSDP ratio present challenges that necessitate stringent debt management and fiscal prudence to ensure long-term financial sustainability.
- Schematic Budget and Resource Allocation
- Strategic Allocation of Funds:
- Schematic Budget Outlay for 2023-24: ₹1,84,311.57 crore, with major allocations to social and community services (52.65%), energy (13.67%), and rural development (10.79%).
- Efficient Utilization: Utilized ₹1,58,714.39 crore out of the planned outlay, demonstrating effective budget execution.
- Prioritization of Key Sectors:
- Social and Community Services: Largest share indicating a focus on welfare and inclusive growth.
- Energy and Rural Development: Significant investments aimed at enhancing infrastructure and supporting economic activities.
- Key Insight: The schematic budget reflects Rajasthan’s prioritization of social services, energy, and rural development, ensuring that funds are allocated to areas critical for inclusive and sustainable growth.
- Role of Externally Aided Projects (EAPs)
- Supplementary Funding for Development:
- Externally Aided Projects: 13 ongoing EAPs with a total expenditure of ₹4,037.09 crore in 2023-24.
- Diverse Funding Sources: Collaboration with international financial institutions like the World Bank, ADB, and JICA to finance infrastructure and social sector projects.
- Project Progress and Impact:
- Infrastructure Enhancement: EAPs have significantly contributed to improving water supply, road infrastructure, and energy projects.
- Social Sector Improvements: Projects aimed at rural water supply, fluorosis mitigation, and dam rehabilitation have enhanced public health and safety.
- Key Insight: Externally aided projects are pivotal in bridging the resource gap, enabling Rajasthan to undertake large-scale infrastructure and social projects that might otherwise be constrained by state financial limitations.
- Public-Private Partnerships (PPPs)
- Enhanced Private Participation:
- Completed and Ongoing PPP Projects: 197 completed projects worth ₹17,790.59 crore, 28 under implementation, and 29 in the pipeline.
- Institutional Framework: Establishment of committees like the Council for Infrastructure Development (CID) and Empowered Committee for Infrastructure Development (ECID) to oversee PPP projects.
- Sectoral Focus:
- Roads, Energy, and Urban Infrastructure: Majority of PPP projects are concentrated in these sectors, driving efficiency and leveraging private sector expertise.
- Key Insight: PPPs are essential for mobilizing private investment and expertise, allowing Rajasthan to accelerate infrastructure development while maintaining fiscal discipline. The structured institutional framework ensures effective project management and implementation.
- Challenges and Recommendations
- Managing Rising Debt Levels:
- Debt Burden: Continued increase in fiscal liabilities necessitates robust debt management strategies to prevent fiscal stress.
- Debt Reduction: Implementing measures to reduce reliance on borrowed funds and focusing on sustainable financing options.
- Enhancing Revenue Streams:
- Diversification: Expanding revenue sources beyond traditional taxes to include innovative revenue-generating mechanisms.
- Efficiency: Improving tax administration and reducing leakages to maximize revenue collection.
- Increasing Capital Expenditure:
- Infrastructure Investment: Boosting capital outlay to support infrastructure projects essential for economic growth and development.
- Balanced Growth: Ensuring that capital investments are aligned with long-term development goals.
- Strengthening Fiscal Discipline:
- Budgetary Controls: Implementing stringent budgetary controls to manage expenditure and prevent fiscal deficits from escalating.
- Transparency and Accountability: Enhancing transparency in financial management to build trust and ensure efficient use of resources.
- Key Insight: Addressing fiscal challenges requires a multifaceted approach, including debt management, revenue diversification, increased capital investment, and enhanced fiscal discipline to ensure sustainable and balanced economic growth.
- Future Outlook
- Sustainable Growth Initiatives:
- Inclusive Development: Continuing focus on social and economic services to promote inclusive growth and reduce socio-economic disparities.
- Infrastructure Development: Ongoing and planned projects in infrastructure sectors to support long-term economic expansion.
- Leveraging External Aid and PPPs:
- Maximizing External Funding: Efficient utilization of externally aided projects to supplement state resources and drive development.
- Expanding PPPs: Increasing the scope and scale of PPP initiatives to cover more sectors and regions within the state.
- Policy Reforms and Innovations:
- Fiscal Reforms: Implementing policy reforms to enhance fiscal management, improve revenue generation, and control expenditure.
- Innovative Financing: Exploring innovative financing mechanisms to support infrastructure and social projects without exacerbating fiscal deficits.
- Key Insight: Looking ahead, Rajasthan must continue to build on its financial strengths while addressing its fiscal challenges through strategic planning, policy reforms, and effective utilization of external and private sector resources to achieve sustainable and inclusive development.
Final Thoughts
- Revenue Growth: Strong growth in tax revenue highlights effective tax administration and improved compliance.
- Expenditure Management: Balanced focus on developmental expenditure with control over recurrent costs, but further efficiency in salary and wage expenses is needed.
- Debt Concerns: Rising fiscal liabilities and high debt-to-GSDP ratio necessitate improved debt management strategies to ensure fiscal sustainability.
- Developmental Focus: Significant investment in social services, rural development, and infrastructure, reflecting a commitment to inclusive growth.
- Externally Aided Projects (EAPs): External funding has been pivotal for infrastructure development, supplementing the state’s financial resources.
- Public-Private Partnerships (PPPs): Growing reliance on PPPs has mobilized private investments for infrastructure projects, reducing the strain on state finances.
- Challenges Ahead: Addressing rising debt, enhancing revenue streams, and increasing capital investment are critical to maintaining fiscal health.
Chapter 10 underscores Rajasthan’s efforts to manage its finances while pursuing inclusive growth through developmental expenditure and externally funded projects. The state’s robust tax collection efforts and the efficient management of PPP initiatives are commendable. However, challenges related to fiscal deficits and rising debt demand prudent fiscal management and a strong focus on debt reduction strategies.
Chapter 10
Table 10.1
Analytical Summary
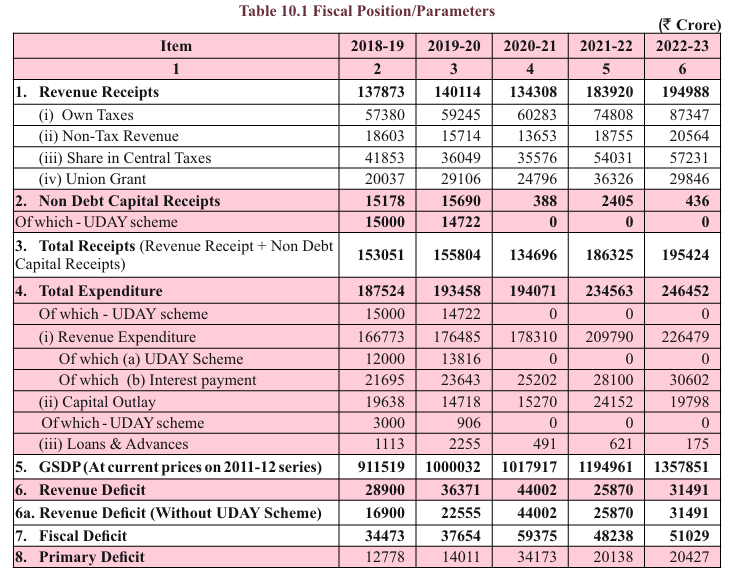
The table presents a detailed breakdown of the fiscal position and parameters for the state over the fiscal years from 2018-19 to 2022-23. The key indicators include revenue receipts, non-debt capital receipts, total receipts, total expenditure, fiscal deficit, and primary deficit. These metrics offer insight into the state’s fiscal health and budget management, illustrating trends in government earnings, spending, and deficits.
Key Data Points
- Revenue Receipts: Steady increase over the years, from ₹137,873 crore in 2018-19 to ₹194,988 crore in 2022-23.
- Non-Debt Capital Receipts: Significant fluctuation with a peak of ₹15,690 crore in 2019-20 but only ₹436 crore in 2022-23.
- Total Receipts: Grew from ₹153,051 crore in 2018-19 to ₹195,424 crore in 2022-23.
- Total Expenditure: Marked growth from ₹187,524 crore in 2018-19 to ₹246,452 crore in 2022-23.
- Revenue Deficit: Decreased from ₹44,000 crore in 2020-21 to ₹31,491 crore in 2022-23, indicating fiscal improvement.
- Fiscal Deficit: Peaked at ₹59,375 crore in 2020-21 but reduced to ₹48,238 crore in 2022-23.
- Primary Deficit: After reaching ₹34,173 crore in 2020-21, the primary deficit reduced to ₹20,427 crore in 2022-23.
Key Observations
- Increasing Revenue Receipts: A steady rise in revenue receipts, particularly from state taxes, indicates stronger revenue collection, rising from ₹137,873 crore in 2018-19 to ₹194,988 crore in 2022-23.
- Fiscal Deficit Trends: The fiscal deficit has declined from the pandemic-affected year of 2020-21 (₹59,375 crore) to ₹48,238 crore in 2022-23. This points to improved budgetary management.
- Expenditure Growth: Total expenditure, including capital outlay, has shown consistent growth, signifying higher spending on infrastructure, development, and interest payments.
- UDAY Scheme Impact: The absence of UDAY scheme-related receipts or expenditures post-2019-20 reflects the completion or phasing out of this financial intervention aimed at the power sector.
- Primary Deficit Improvement: The primary deficit has been reduced significantly since 2020-21, highlighting a reduction in the state’s non-interest-bearing liabilities.
Key Terms
- Revenue Receipts: The income the government receives from its own taxes, non-tax sources, and shares of central taxes and grants.
- Non-Debt Capital Receipts: Receipts that do not create liabilities or reduce financial assets, often reflecting capital transfers.
- Total Expenditure: The government’s total spending, encompassing revenue and capital expenditures.
- Revenue Deficit: The shortfall when revenue receipts are less than revenue expenditure.
- Fiscal Deficit: The gap between the government’s total expenditure and its total receipts (excluding borrowings).
- Primary Deficit: The fiscal deficit excluding interest payments, indicating the extent of borrowing required to meet the state’s basic expenses.
Key Insights
- The increasing revenue receipts are a positive signal for the state’s fiscal sustainability.
- The control over the fiscal deficit post-pandemic, while still high, is a positive sign of improved financial discipline.
- The consistent growth in total expenditure reflects the state’s commitment to infrastructure and social development but also highlights growing liabilities, especially interest payments.
- The decline in non-debt capital receipts, especially after the cessation of the UDAY scheme, suggests reduced capital resource inflows, potentially affecting future investment capacity.
Conclusion
The fiscal position of the state has shown resilience with improving revenue collection and declining fiscal deficits, particularly in the post-pandemic period. However, the high expenditure growth, particularly in interest payments, poses a challenge for fiscal sustainability. Managing the balance between revenue and expenditure will be crucial for maintaining the state’s fiscal health in the coming years.
Table – Fiscal Deficit to GSDP, Revenue Growth, and Debt Overview

Analytical Summary
This table outlines key fiscal indicators for the state, focusing on fiscal deficit as a percentage of GSDP, growth in revenue receipts, tax revenue, and the debt burden over five years (2018-19 to 2022-23). It also details expenditure on salaries, wages, and interest payments as a proportion of revenue receipts and expenditure.
Key Data Points
- Fiscal Deficit to GSDP: Shows a peak in 2020-21 at 5.83% but improves significantly to 3.76% by 2022-23.
- Growth Rate of Revenue Receipts: Varied growth, with a high of 36.94% in 2021-22 post-pandemic, slowing to 6.02% in 2022-23.
- Own Tax Revenue Growth: Substantial increase of 24.09% in 2021-22, followed by a slight dip to 16.76% in 2022-23.
- Expenditure on Salary and Wages: Gradually increasing from ₹49,790 crore in 2018-19 to ₹59,774 crore in 2022-23.
- Interest Payments: Rise from ₹21,695 crore in 2018-19 to ₹30,602 crore in 2022-23, with interest payments consuming around 13-18% of revenue receipts each year.
- Debt and Liabilities: A consistent rise, reaching ₹505,574 crore in 2022-23, constituting 37.23% of GSDP.
Key Observations
- Fiscal Deficit: The fiscal deficit as a percentage of GSDP saw a spike during the pandemic years but has been brought down steadily by 2022-23, signaling fiscal consolidation.
- Revenue Growth: After a sharp decline in 2020-21, the rate of growth in revenue receipts surged in 2021-22, indicating economic recovery. However, the slower growth in 2022-23 (6.02%) may suggest challenges in sustaining this momentum.
- Tax Revenue: Own tax revenue showed significant recovery post-pandemic, growing at 16.76% in 2022-23, signaling improved fiscal performance through internal revenue mobilization.
- Rising Debt: The continuous increase in debt, reaching ₹505,574 crore in 2022-23, reflects higher borrowing, although the debt-to-GSDP ratio improved marginally from 40.33% in 2020-21 to 37.23% in 2022-23.
- Interest Payments: As a percentage of revenue receipts, interest payments peaked at 18.76% in 2020-21, but reduced to 15.69% in 2022-23. This shows the state’s focus on managing debt servicing costs, even as overall debt rises.
Key Terms
- Fiscal Deficit to GSDP: The ratio of the fiscal deficit to the Gross State Domestic Product, measuring the extent of government borrowing in relation to state output.
- Revenue Receipts: Income from own taxes, non-tax revenues, and the state’s share in central taxes and grants.
- Own Tax Revenue: Revenue collected from state taxes such as sales tax, excise duties, property tax, etc., which directly contributes to the state’s budget.
- Expenditure on Salary and Wages: Payments made by the government to its employees, an essential part of revenue expenditure.
- Debt and Liabilities: The total outstanding financial liabilities of the state, including public debt and other borrowings.
Key Insights
- Fiscal Stability: The reduction in the fiscal deficit from its pandemic peak of 5.83% to 3.76% of GSDP reflects improved fiscal discipline and economic recovery.
- Revenue Management: While the growth rate in revenue receipts declined to 6.02% in 2022-23, the steady increase in own tax revenue indicates better internal resource mobilization.
- Debt Sustainability: Although debt levels are increasing, the stabilization of the debt-to-GSDP ratio suggests that the state is maintaining a reasonable level of borrowing relative to its output.
- Salary and Interest Expenditure: Both salaries and interest payments take up a significant portion of revenue receipts, reflecting constraints on fiscal flexibility. Continued focus on managing these expenditures will be crucial for maintaining budgetary balance.
Conclusion
The state’s fiscal indicators show an overall trend of recovery and improved management, especially post-pandemic. However, the rising debt and the high proportion of revenue dedicated to salaries and interest payments are areas that require attention to ensure long-term fiscal sustainability. Managing the debt burden while boosting revenue receipts and controlling expenditure will be key to maintaining financial health in the future.
Figure 10.1

Analytical Summary
This figure illustrates the components of revenue receipts for the state over five fiscal years (2018-19 to 2022-23). The revenue is categorized into four key sources: Own Taxes Revenue, Non-Tax Revenue, Share in Central Taxes, and Union Grants. The data shows year-on-year variations in revenue collection, highlighting the state’s increasing dependence on its own taxes and central contributions.
Key Data Points
- 2018-19: Total revenue receipts around ₹137,873 crore, dominated by own tax revenue.
- 2019-20: Slight increase in total revenue receipts to ₹140,114 crore, with contributions from all components remaining relatively stable.
- 2020-21: A decline in total revenue receipts to ₹134,308 crore, likely due to the impact of the COVID-19 pandemic.
- 2021-22: A significant rise in revenue receipts to ₹183,920 crore, showing post-pandemic recovery, with increases in all revenue components.
- 2022-23: Further increase to ₹194,988 crore, with a substantial contribution from own tax revenue and a stable share from central taxes.
Key Observations
- Own Tax Revenue: The largest and steadily growing contributor across all years, peaking in 2022-23 at around ₹87,347 crore.
- Non-Tax Revenue: Relatively stable but shows a minor dip in 2020-21. It contributes moderately to the total revenue receipts.
- Share in Central Taxes: Notable fluctuations, with a significant increase in 2021-22, reflecting central tax sharing mechanisms and fiscal federalism.
- Union Grants: Contributions from Union Grants exhibit fluctuations but show a strong recovery in 2021-22 after dipping in 2020-21.
Key Terms
- Own Taxes Revenue: Revenue generated by the state from its taxes, including property tax, sales tax, excise duties, etc.
- Non-Tax Revenue: Revenue that the state earns from sources other than taxes, such as fees, fines, interest on investments, and income from state-owned enterprises.
- Share in Central Taxes: The proportion of central tax revenue that is distributed to states based on recommendations by the Finance Commission.
- Union Grants: Financial assistance provided by the central government to state governments for specific projects or to support state budgets.
Key Insights
- Pandemic Impact: The year 2020-21 saw a noticeable dip in revenue receipts, reflecting the economic slowdown caused by the pandemic. However, 2021-22 marks a significant recovery.
- Dependence on Own Tax Revenue: The state’s increasing reliance on its own tax revenue is evident, with it forming the bulk of revenue receipts by 2022-23. This indicates growing fiscal independence.
- Fluctuations in Central Transfers: Both the share in central taxes and union grants show notable fluctuations, suggesting that the state’s financial planning may be sensitive to central government policies and fiscal transfers.
Conclusion
The figure highlights a positive trend in the state’s revenue receipts over time, with own tax revenue being the most substantial contributor. The state’s resilience in recovering from the economic impact of COVID-19 is visible in the strong growth in 2021-22 and 2022-23. However, the fluctuations in central transfers underscore the importance of a balanced revenue strategy to ensure fiscal stability. The consistent growth in own tax revenue also reflects a strengthening tax base and improved tax collection efforts by the state.
Figure 10.2

Analytical Summary
This graph illustrates the year-on-year percentage growth in revenue receipts for the state from 2019-20 to 2022-23. It showcases the impact of external factors like the COVID-19 pandemic on revenue generation and the state’s recovery trajectory in the subsequent years.
Key Data Points
- 2019-20: Growth in revenue receipts was marginal at 1.63%, indicating a stable yet slow increase from the previous fiscal year.
- 2020-21: The revenue receipts contracted by -4.14%, reflecting the severe economic impact caused by the COVID-19 pandemic, which led to decreased revenue collection.
- 2021-22: A dramatic recovery is observed with a growth rate of 36.94%, suggesting a robust bounce-back in economic activity and an increase in revenue collection post-pandemic.
- 2022-23: Growth stabilized to 6.02%, indicating sustained but slower recovery following the strong rebound of the previous year.
Key Observations
- The growth trend shows significant fluctuations over the four-year period, with a noticeable dip during the pandemic year (2020-21) followed by a robust recovery in 2021-22.
- The 36.94% growth in 2021-22 marks a sharp recovery, which is likely due to post-pandemic economic reforms, increased fiscal activity, and improved tax collection efforts.
- The growth rate for 2022-23 at 6.02% suggests a normalization of economic activity, though at a slower pace compared to the sharp rebound in 2021-22.
Key Terms
- Revenue Receipts: The income received by the government from its various revenue sources, including taxes, fees, fines, and central government transfers.
- Growth in Revenue Receipts: The year-on-year percentage increase (or decrease) in total revenue receipts for the state.
- Pandemic Impact: The contraction in 2020-21 reflects the economic downturn caused by the COVID-19 pandemic, which disrupted revenue collection across sectors.
Key Insights
- Pandemic’s Economic Impact: The -4.14% contraction in 2020-21 highlights the financial strain during the pandemic. The recovery trajectory in subsequent years underscores the resilience of the state’s economy.
- Strong Post-Pandemic Recovery: The 36.94% growth in 2021-22 suggests that the state’s fiscal policies and economic interventions played a significant role in boosting revenue collection after the pandemic’s negative effects.
- Sustainable Growth: The 6.02% growth in 2022-23 is a sign of stabilization, marking a return to more consistent and predictable revenue growth after a period of volatility.
Conclusion
The graph highlights the impact of external shocks, like the pandemic, on the state’s fiscal health and revenue generation. While 2020-21 saw a contraction, the sharp rebound in 2021-22 showcases the effectiveness of recovery measures. The growth in 2022-23, though slower, indicates a steady path towards sustained economic stability. Managing revenue collection in future years will likely focus on maintaining steady growth while preparing for potential external challenges.
Figure 10.3
Analytical Summary
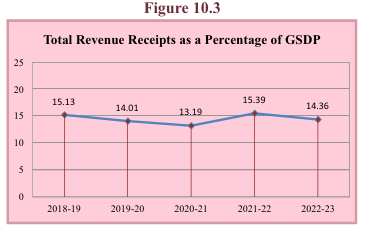
The graph represents the percentage of total revenue receipts relative to the Gross State Domestic Product (GSDP) from 2018-19 to 2022-23. It shows a fluctuating trend in the ratio, indicating the state’s ability to generate revenue in proportion to its economic output.
Key Data Points
- 2018-19: Revenue receipts as a percentage of GSDP stood at 15.13%, suggesting a healthy contribution of revenues to the state economy.
- 2019-20: A slight dip occurred, with the ratio falling to 14.01%, reflecting a lower revenue collection relative to GSDP.
- 2020-21: The ratio decreased further to 13.19%, marking the lowest point during the pandemic-affected fiscal year.
- 2021-22: A recovery was noted, with the percentage rising to 15.39%, reflecting an increase in revenue collection post-pandemic.
- 2022-23: The ratio slightly decreased again to 14.36%, indicating a minor contraction but still higher than pandemic levels.
Key Observations
- There is a cyclical fluctuation in the revenue-to-GSDP ratio, with a noticeable dip during the pandemic (2020-21) and subsequent recovery in 2021-22.
- The percentage does not show drastic variations, implying that the state’s revenue-generating capacity has been relatively stable in relation to its economic size.
- The post-pandemic recovery in 2021-22 highlights the effectiveness of the state’s fiscal measures to increase revenue as economic activities resumed.
Key Terms
- GSDP (Gross State Domestic Product): The total value of all goods and services produced within the state’s economy in a given year. It is a key indicator of economic activity.
- Revenue Receipts as a Percentage of GSDP: This ratio measures the government’s ability to collect revenue relative to the size of its economy, serving as an indicator of fiscal health.
- Fiscal Health: Refers to the overall financial health of a state, often measured through the balance between revenue collection and public expenditure in relation to economic output.
Key Insights
- Steady Fiscal Performance: Despite the economic disruptions caused by the pandemic, the ratio only dropped slightly in 2020-21, showcasing some resilience in revenue collection processes.
- Post-Pandemic Recovery: The rebound to 15.39% in 2021-22 reflects a strong fiscal recovery following the pandemic-induced contraction, highlighting the state’s capacity to mobilize resources during a time of economic expansion.
- Long-Term Stability: The relatively narrow range (13.19% to 15.39%) over the five-year period indicates that revenue collection remains stable relative to the state’s overall economic output.
Conclusion
The graph shows that the state has maintained a relatively stable revenue collection in relation to its GSDP, with some expected fluctuations due to external shocks like the pandemic. The recovery in 2021-22 demonstrates the effectiveness of post-pandemic fiscal measures, while the slight contraction in 2022-23 suggests a need for continued focus on enhancing revenue generation in relation to economic growth. Maintaining or increasing this ratio will be crucial for ensuring that the state has sufficient resources to meet its expenditure needs as the economy grows.
Figure 10.4

Analytical Summary
The graph illustrates the fiscal deficit of the state over the period from 2018-19 to 2022-23, showing how the fiscal health of the state has changed over time. The fiscal deficit represents the shortfall where the government’s expenditure exceeds its revenue.
Key Data Points
- 2018-19: The fiscal deficit was ₹34,473 crore, indicating a manageable gap between revenue and expenditure.
- 2019-20: A moderate increase brought the deficit to ₹37,654 crore, reflecting higher spending without proportionate revenue growth.
- 2020-21: The fiscal deficit spiked to ₹59,375 crore, the highest in the observed period, likely due to pandemic-related expenditures and reduced revenues.
- 2021-22: The deficit reduced to ₹48,238 crore, reflecting an improvement in fiscal management post-pandemic.
- 2022-23: A further reduction to ₹51,029 crore, though still elevated compared to pre-pandemic levels.
Key Observations
- Sharp Increase in 2020-21: The significant increase in fiscal deficit in 2020-21 is a direct result of the COVID-19 pandemic, where both revenue shortfalls and emergency expenditures inflated the deficit.
- Gradual Decline Post-Pandemic: After the peak in 2020-21, the fiscal deficit has decreased but remains higher than pre-pandemic levels, indicating that recovery is underway but is not yet complete.
- Stability Between 2021-22 and 2022-23: The figures for 2022-23 show a slight increase from the previous year but do not mark a drastic difference, suggesting that fiscal policies have managed to keep the deficit somewhat controlled.
Key Terms
- Fiscal Deficit: The amount by which a government’s total expenditures exceed its total revenue (excluding borrowings). It is an indicator of the government’s borrowing needs.
- Revenue: Refers to all income earned by the government through taxes and other means.
- Expenditure: Refers to government spending on various services, projects, and subsidies.
Key Insights
- Pandemic’s Fiscal Impact: The 2020-21 fiscal year demonstrates the severe impact of the pandemic on the state’s finances, necessitating higher borrowing and leading to a record fiscal deficit.
- Recovery Period: Although the fiscal deficit has decreased post-pandemic, it still remains high, suggesting that while the state has made strides in recovery, long-term fiscal strategies are needed to stabilize and reduce the deficit further.
- Sustained Expenditure: The sustained level of fiscal deficit post-pandemic suggests that certain expenditure commitments have been maintained, possibly to support economic recovery and public services, even as revenues have not fully rebounded.
Conclusion
The graph clearly reflects the fiscal challenges faced by the state, particularly during the pandemic. While efforts have been made to reduce the fiscal deficit, further actions are required to ensure the state moves toward fiscal sustainability. This will likely involve balancing revenue generation with prudent spending to prevent future fiscal stress while still supporting critical sectors like health, education, and infrastructure.
Figure 10.5
Analytical Summary
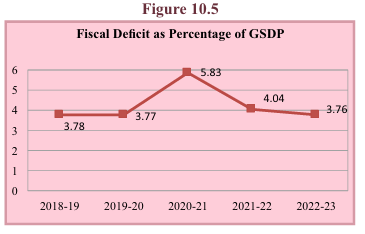
This chart depicts the fiscal deficit as a percentage of the state’s Gross State Domestic Product (GSDP) from 2018-19 to 2022-23. It shows how the fiscal deficit as a share of economic output fluctuated during this period, giving insight into the state’s fiscal health relative to the size of its economy.
Key Data Points
- 2018-19: The fiscal deficit was 3.78% of GSDP.
- 2019-20: It slightly decreased to 3.77% of GSDP.
- 2020-21: There was a sharp increase to 5.83%, reflecting the impact of the pandemic.
- 2021-22: The percentage dropped to 4.04%, showing improvement post-pandemic.
- 2022-23: The fiscal deficit as a percentage of GSDP reduced further to 3.76%, nearing pre-pandemic levels.
Key Observations
- Steady Pre-Pandemic Levels (2018-20): The fiscal deficit remained relatively stable before the pandemic, with a slight reduction from 3.78% to 3.77%.
- Pandemic Impact in 2020-21: The sharp increase to 5.83% in 2020-21 reflects the significant impact of the COVID-19 pandemic, where fiscal pressures increased due to reduced revenue and higher public expenditures.
- Post-Pandemic Recovery: From 2021-22 onward, the fiscal deficit as a percentage of GSDP shows a consistent downward trend, indicating fiscal consolidation efforts by the state.
- 2022-23 Nears Pre-Pandemic Levels: At 3.76%, the fiscal deficit in 2022-23 is nearly the same as in 2018-19, suggesting that the state has brought its fiscal situation under control.
Key Terms
- Fiscal Deficit: The difference between total government expenditure and revenue, indicating how much the government needs to borrow.
- GSDP (Gross State Domestic Product): The total value of goods and services produced in the state, representing the size of the economy.
- Fiscal Deficit as Percentage of GSDP: A measure that compares the fiscal deficit to the size of the state’s economy, providing insight into the sustainability of the deficit.
Key Insights
- Pandemic Effect: The spike in 2020-21 clearly demonstrates how the pandemic disrupted fiscal balance, requiring significantly higher borrowing as a percentage of economic output.
- Economic Recovery: The subsequent decline in the fiscal deficit ratio to 3.76% in 2022-23 suggests a recovery in both revenue generation and expenditure control, pointing towards improved economic management.
- Stability in Public Finances: The return to pre-pandemic fiscal deficit levels suggests that while there is still work to be done, the state’s finances have become more stable.
Conclusion
The graph reflects the state’s fiscal management over a period of economic disruptions caused by the pandemic. The rapid rise and subsequent decline in the fiscal deficit as a percentage of GSDP show the challenges faced and the recovery efforts that followed. The state appears to be on a trajectory toward fiscal stability, as the deficit ratio in 2022-23 nearly mirrors the pre-pandemic period, but continued efforts in revenue enhancement and expenditure management will be key to maintaining this balance.
Figure 10.6
Analytical Summary
This chart shows the revenue deficit as a percentage of the Gross State Domestic Product (GSDP) from 2018-19 to 2022-23, both with and without the UDAY scheme. The UDAY scheme was implemented to alleviate the debt burden on state power distribution companies, and its inclusion significantly influences the revenue deficit figures.
Key Data Points
- Without UDAY Scheme:
- 2018-19: 1.85%
- 2019-20: 2.26%
- 2020-21: 4.32%
- 2021-22: 2.16%
- 2022-23: 2.32%
- With UDAY Scheme (where applicable):
- 2018-19: 3.17%
- 2019-20: 3.64%
Key Observations
- Impact of UDAY Scheme: The revenue deficit figures were higher in 2018-19 and 2019-20 when the UDAY scheme was considered. Post 2019-20, the graph without the UDAY scheme reflects the state’s revenue deficit independently.
- 2020-21 Pandemic Spike: A significant increase in the revenue deficit occurred in 2020-21, reaching 4.32%. This aligns with the increased fiscal pressures during the pandemic, leading to higher borrowing to meet revenue shortfalls.
- Post-Pandemic Stabilization: In 2021-22, the revenue deficit dropped to 2.16%, indicating fiscal recovery, followed by a slight rise to 2.32% in 2022-23, but still lower than the pandemic peak.
Key Terms
- Revenue Deficit: The gap between revenue expenditure (spending on day-to-day operations) and revenue receipts (tax and non-tax revenue).
- UDAY Scheme: Ujwal DISCOM Assurance Yojana, a scheme launched by the central government to address the financial distress of power distribution companies (DISCOMs) by transferring debt onto state governments.
- GSDP: Gross State Domestic Product, representing the total economic output of a state.
Key Insights
- Pandemic Disruption: The spike in the revenue deficit during 2020-21 reflects the severe financial strain brought on by the COVID-19 pandemic, reducing state revenues and increasing the need for borrowing.
- UDAY Scheme Influence: The inclusion of the UDAY scheme increases the state’s financial burden, but post-UDAY data provides a clearer picture of underlying fiscal trends.
- Ongoing Recovery: The fiscal deficit reduction from 2020-21 to 2021-22 suggests a recovery in state finances, though the slight uptick in 2022-23 indicates continued fiscal challenges.
Conclusion
The revenue deficit as a percentage of GSDP provides insight into the state’s fiscal management, particularly in handling the increased financial pressure during and after the pandemic. The inclusion of the UDAY scheme emphasizes the additional burden faced by the state due to the financial distress in the power sector. Despite improvement from the pandemic peak, the state needs to continue focusing on revenue generation and expenditure control to stabilize its fiscal health in the coming years.
Figure 10.7

Analytical Summary
This figure presents the revenue deficit as a percentage of revenue receipts from 2018-19 to 2022-23, with and without the inclusion of the UDAY scheme. It highlights the state’s fiscal performance relative to its revenue collection over the five-year period.
Key Data Points
- Without UDAY Scheme:
- 2018-19: 12.26%
- 2019-20: 16.10%
- 2020-21: 32.76%
- 2021-22: 14.07%
- 2022-23: 16.15%
- With UDAY Scheme:
- 2018-19: 20.96%
- 2019-20: 25.96%
Key Observations
- Pre-Pandemic Growth: Both with and without the UDAY scheme, the revenue deficit as a percentage of revenue receipts increased during the initial years, indicating that the state was facing rising fiscal pressures.
- Pandemic Peak: In 2020-21, the revenue deficit peaked at 32.76% without the UDAY scheme, reflecting the immense fiscal strain brought on by the COVID-19 pandemic. Revenue shortfalls were much greater than normal due to disruptions in economic activities.
- Post-Pandemic Decline: Post-pandemic, the revenue deficit percentage decreased to 14.07% in 2021-22, indicating a partial recovery, but it slightly increased again to 16.15% in 2022-23.
Key Terms
- Revenue Deficit: The shortfall in revenue receipts over revenue expenditure, indicating how much more the government is spending compared to its earnings from taxes and other sources.
- UDAY Scheme: Ujwal DISCOM Assurance Yojana, a debt relief program for power distribution companies, impacts the state’s fiscal deficit when accounted for in the overall fiscal data.
- Revenue Receipts: These are earnings of the government from various sources such as taxes, duties, and non-tax revenues like interest, dividends, and grants.
Key Insights
- Significant Impact of the Pandemic: The revenue deficit as a percentage of revenue receipts skyrocketed during the pandemic year (2020-21), reaching over 32%, indicating the state’s substantial dependency on borrowing to meet its expenditure during the crisis.
- UDAY Scheme Influence: With the UDAY scheme included, the revenue deficit is significantly higher in earlier years, showing the scheme’s added financial burden on the state.
- Partial Recovery Post-Pandemic: The improvement in the revenue deficit after 2020-21, though short-lived, indicates the state’s effort to bring its fiscal house in order post the COVID-19 economic shock.
Conclusion
The revenue deficit as a percentage of revenue receipts reveals the financial health and sustainability of the state’s revenue generation relative to its expenses. The impact of the UDAY scheme adds to the fiscal challenges, as seen in 2018-19 and 2019-20. The dramatic spike in the revenue deficit during the pandemic highlights the state’s fiscal vulnerability to economic shocks. However, post-pandemic recovery efforts have helped reduce the deficit, though challenges remain, as indicated by the slight increase in 2022-23. Going forward, reducing the revenue deficit will be crucial for maintaining fiscal sustainability.
Figure 10.8

Analytical Summary
The graph depicts the state’s revenue expenditure from the fiscal years 2018-19 to 2022-23. Revenue expenditure refers to the government’s spending on day-to-day activities and services, such as salaries, pensions, and subsidies. This type of expenditure does not create assets but is necessary for maintaining the functioning of government services.
Key Data Points
- 2018-19: ₹ 166,773 crore
- 2019-20: ₹ 176,485 crore
- 2020-21: ₹ 178,310 crore
- 2021-22: ₹ 209,790 crore
- 2022-23: ₹ 226,479 crore
Key Observations
- Steady Increase: There has been a consistent increase in revenue expenditure over the five years, with the largest jump between 2020-21 and 2021-22, where the expenditure increased by over ₹30,000 crore.
- Post-Pandemic Surge: The highest expenditure of ₹ 226,479 crore was observed in 2022-23, reflecting the state’s increased spending to manage post-pandemic recovery, inflationary pressures, and social welfare initiatives.
- Moderate Growth Pre-Pandemic: Before the COVID-19 pandemic, the growth in revenue expenditure was more gradual, with an average yearly increase of around ₹10,000 crore from 2018-19 to 2019-20 and from 2019-20 to 2020-21.
Key Terms
- Revenue Expenditure: Spending by the government on its regular functioning, such as paying salaries, pensions, subsidies, and other operational expenses. It does not result in the creation of long-term assets.
- Fiscal Deficit: The gap between total expenditure and total receipts (excluding borrowings) that needs to be financed through borrowing. Revenue expenditure is a significant part of this equation.
Key Insights
- Post-Pandemic Expansion: The sharp increase in revenue expenditure in 2021-22 and 2022-23 signals a more active role of the state in providing economic support and recovery measures after the pandemic. The state likely increased spending on welfare schemes, health services, and subsidies to counter the socio-economic challenges.
- Increasing Fiscal Pressure: With revenue expenditure rising sharply, the state may face challenges in keeping its fiscal deficit under control. High revenue expenditure with moderate revenue growth could indicate a widening gap between income and expenditure.
- Sustainability of Expenditure: While high revenue expenditure might be necessary for economic recovery, the state will need to balance its budget by either increasing its revenue receipts or optimizing expenditure to avoid over-borrowing.
Conclusion
The consistent rise in revenue expenditure, especially post-pandemic, indicates the government’s focus on maintaining essential services and aiding economic recovery. However, the sharp increase in recent years could put pressure on fiscal sustainability, especially if revenue receipts do not keep pace. Balancing growth in revenue expenditure with efficient fiscal management will be crucial for long-term economic health.
Figure 10.9
Analytical Summary
The graph illustrates the growth rate of revenue expenditure over the fiscal years 2019-20 to 2022-23. Revenue expenditure growth reflects the increase in government spending on its regular operations, including social welfare schemes, salaries, pensions, and subsidies.
Key Data Points
- 2019-20: 5.82%
- 2020-21: 1.01%
- 2021-22: 17.65%
- 2022-23: 7.96%
Key Observations
- Slow Growth in 2020-21: The growth rate dropped significantly to just 1.01% in 2020-21, likely due to constraints imposed by the COVID-19 pandemic, where the government had to carefully manage resources amidst declining revenues.
- Surge in 2021-22: There was a sharp increase in the growth rate to 17.65% in 2021-22. This significant rise can be attributed to heightened government expenditure for pandemic recovery, including health spending, social support measures, and other welfare programs.
- Moderation in 2022-23: The growth rate fell to 7.96% in 2022-23, still representing a considerable rise but showing a return to more moderate growth after the large increase the year before.
Key Terms
- Revenue Expenditure: Government spending on its normal activities, which does not result in the creation of assets. This includes wages, subsidies, and operating expenses.
- Growth Rate: The percentage change from one period to another in financial terms, reflecting how fast government spending is increasing over time.
Key Insights
- Pandemic Impact: The revenue expenditure growth rate in 2020-21 slowed to just 1%, indicating that the government had limited capacity for expanding expenditure during the height of the pandemic, likely due to falling revenue collections and disruptions.
- Post-Pandemic Recovery: The sharp growth in 2021-22 of over 17% reflects the government’s increased spending to stimulate economic recovery, including healthcare, welfare, and economic revival programs. This growth was necessary to cushion the post-pandemic challenges.
- Returning to Moderation: The growth rate of 7.96% in 2022-23, while still significant, shows that the government is attempting to moderate expenditure after the surge, perhaps aiming to stabilize fiscal management after the pandemic.
Conclusion
The growth rate of revenue expenditure between 2019-20 and 2022-23 reflects the significant fiscal challenges brought about by the pandemic and the government’s subsequent response. The steep rise in expenditure growth in 2021-22 underscores the state’s commitment to managing the economic and social impacts of COVID-19. However, the moderated growth in 2022-23 indicates a return to more controlled spending. Maintaining a balance between necessary expenditures and fiscal sustainability will be key for the future.
Figure 10.10

Analytical Summary
This figure illustrates the trend of interest payments made by the state government from the fiscal year 2018-19 to 2022-23. Interest payments are a major component of a government’s fiscal expenditure, representing the cost of borrowing to meet various fiscal obligations.
Key Data Points
- 2018-19: ₹21,695 crore
- 2019-20: ₹23,643 crore
- 2020-21: ₹25,202 crore
- 2021-22: ₹28,100 crore
- 2022-23: ₹30,602 crore
Key Observations
- Consistent Growth: Interest payments have shown a consistent year-on-year increase, growing from ₹21,695 crore in 2018-19 to ₹30,602 crore in 2022-23.
- Notable Increase in 2021-22: There is a noticeable jump between 2020-21 and 2021-22, where the interest payments increased from ₹25,202 crore to ₹28,100 crore, reflecting a sharper growth compared to previous years.
- Steady Rise: The growth continues into 2022-23, where interest payments reached ₹30,602 crore, showing an upward fiscal pressure from increasing debt liabilities.
Key Terms
- Interest Payments: Payments made by the government on its accumulated debt. These are mandatory expenditures, representing the cost of borrowing.
- Fiscal Expenditure: The total spending by a government, including interest, subsidies, wages, and development expenditure.
- Debt Servicing: The process of making interest payments and repaying principal debt.
Key Insights
- Increasing Debt Burden: The steady increase in interest payments over the five-year period signals rising government debt, which adds fiscal pressure as a significant portion of government revenue is allocated to service these interest payments.
- Impact on Development: Higher interest payments imply that a larger share of revenue is being used for debt servicing, potentially limiting resources available for development expenditure and social welfare schemes.
- Fiscal Sustainability: The upward trajectory suggests that managing debt levels and balancing the budget is becoming increasingly important for maintaining fiscal health. Without corrective measures, rising interest payments could crowd out other crucial expenditures.
Conclusion
The continuous rise in interest payments from ₹21,695 crore in 2018-19 to ₹30,602 crore in 2022-23 highlights the increasing fiscal burden on the state’s finances due to growing debt obligations. This trend signals the need for careful fiscal planning to ensure that debt levels remain sustainable and do not unduly limit the government’s ability to finance development and welfare programs. Controlling debt growth and ensuring efficient utilization of borrowed funds will be critical in addressing this fiscal challenge.
Figure 10.11
Analytical Summary
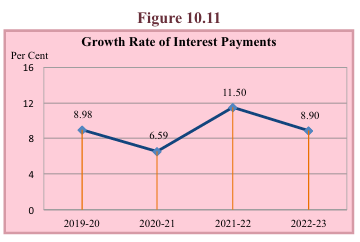
This figure tracks the annual growth rate of interest payments made by the state government from 2019-20 to 2022-23. The growth rate measures how much the cost of debt servicing has increased or decreased each year, providing an indication of the government’s fiscal health concerning its debt management.
Key Data Points
- 2019-20: Growth rate of 8.98%
- 2020-21: Growth rate of 6.59%
- 2021-22: Growth rate of 11.50%
- 2022-23: Growth rate of 8.90%
Key Observations
- Fluctuating Growth: The growth rate of interest payments shows fluctuations during this period. After declining from 8.98% in 2019-20 to 6.59% in 2020-21, it rose significantly to 11.50% in 2021-22 before decreasing slightly to 8.90% in 2022-23.
- Peak in 2021-22: The sharpest increase occurred in 2021-22, where interest payments grew by 11.50%. This indicates a period of increased borrowing or higher interest costs on existing debt during that year.
- Stabilization in 2022-23: By 2022-23, the growth rate slightly declined to 8.90%, suggesting a moderation in the rate of increase in interest payments, but the rate is still higher compared to 2020-21.
Key Terms
- Growth Rate of Interest Payments: The percentage change in interest payments from one year to the next. It indicates how fast the government’s interest liabilities are increasing.
- Debt Servicing: The process of making regular interest and principal payments on borrowed funds.
- Fiscal Health: A measure of how well a government manages its income, expenditures, and debt obligations.
Key Insights
- Rising Cost of Borrowing: The steady growth in interest payments, particularly the 11.50% spike in 2021-22, suggests that the state government may have incurred higher debt or faced increased borrowing costs.
- Volatility in Debt Servicing: The fluctuations in growth rates highlight instability in managing debt liabilities, which could be due to varying interest rates, changes in borrowing patterns, or the maturity of large debt instruments.
- Fiscal Pressure: Higher growth in interest payments places additional pressure on the state’s fiscal resources, potentially limiting funds available for other essential services and development activities.
Conclusion
The fluctuating growth rates of interest payments indicate a period of volatility in debt servicing costs for the state government. The spike in 2021-22 is a concerning sign of increasing fiscal stress, though the slight moderation in 2022-23 shows some stabilization. Going forward, managing the growth of interest payments will be critical to maintaining fiscal balance, particularly in light of the state’s ongoing need for development and welfare spending. Effective debt management strategies and reducing reliance on high-cost borrowing will help ensure that interest payments do not consume an unsustainable portion of government revenue.
Table 10.2

Analytical Summary
The table presents the service-wise distribution of revenue expenditure by the government for the years 2018-19 to 2022-23. It breaks down the total revenue expenditure into three categories: General Services, Social Services, and Economic Services, along with their respective percentages of the total expenditure. The table highlights the government’s spending priorities across sectors, illustrating shifts in the allocation of resources over time.
Key Data Points
- Total Revenue Expenditure (₹ Crore):
- 2018-19: ₹ 1,66,773 crore
- 2022-23: ₹ 2,26,479 crore (an increase of nearly 36% over five years)
- General Services (₹ Crore and % of Total):
- 2018-19: ₹ 54,364 crore (32.60%)
- 2022-23: ₹ 71,875 crore (31.74%)
- Social Services (₹ Crore and % of Total):
- 2018-19: ₹ 65,687 crore (39.39%)
- 2022-23: ₹ 90,168 crore (39.81%)
- Economic Services (₹ Crore and % of Total):
- 2018-19: ₹ 46,722 crore (28.01%)
- 2022-23: ₹ 64,436 crore (28.45%)
Key Observations
- Increasing Total Revenue Expenditure: Over the five-year period, total revenue expenditure increased by approximately ₹ 59,706 crore, reflecting a consistent rise in the government’s spending across sectors.
- Social Services Take Priority: Social Services expenditure saw a steady increase both in terms of absolute figures and as a percentage of total revenue expenditure, rising from 39.39% in 2018-19 to 39.81% in 2022-23. This reflects the government’s prioritization of health, education, and social welfare programs.
- Stable Allocation to General Services: Spending on General Services, including grants-in-aid, grew by ₹ 17,511 crore from 2018-19 to 2022-23, but its share as a percentage of total expenditure remained relatively constant at around 31-32%.
- Economic Services Growth: While the absolute spending on Economic Services increased by ₹ 17,714 crore, its share of total revenue expenditure remained stable, oscillating between 24.76% and 29.46%. This category includes infrastructure, agriculture, and industrial development expenditures.
Key Terms
- Revenue Expenditure: Government spending that does not result in the creation of assets, typically covering salaries, subsidies, interest payments, and maintenance.
- General Services: Expenditures related to government administration, defense, and law enforcement.
- Social Services: Expenditures directed towards health, education, social welfare, and related sectors.
- Economic Services: Expenditures related to economic development, such as infrastructure projects, industry, and agriculture.
Key Insights
- Emphasis on Social Services: The continued increase in Social Services spending, now close to 40% of the total revenue expenditure, signifies a growing focus on sectors that impact the welfare of citizens, such as health, education, and social security.
- Economic Services Importance: Despite some fluctuations, Economic Services remain a crucial part of the expenditure portfolio, reflecting the government’s commitment to economic growth, especially through infrastructure and agricultural investment.
- General Services Remain Constant: While General Services’ share in the total expenditure remains relatively stable, its increase in absolute terms suggests the government’s need to maintain a robust administrative and regulatory framework, despite increasing demands from other sectors.
Conclusion
The data indicates a well-balanced allocation of revenue expenditure, with a clear focus on Social Services, which accounts for the largest share of the total spending. The government’s consistent support for General and Economic Services underscores the importance of administration, infrastructure, and development projects in maintaining overall growth and stability. However, the rising expenditures may necessitate careful fiscal management to ensure sustainable public finances without creating undue financial burdens.
Figure 10.12
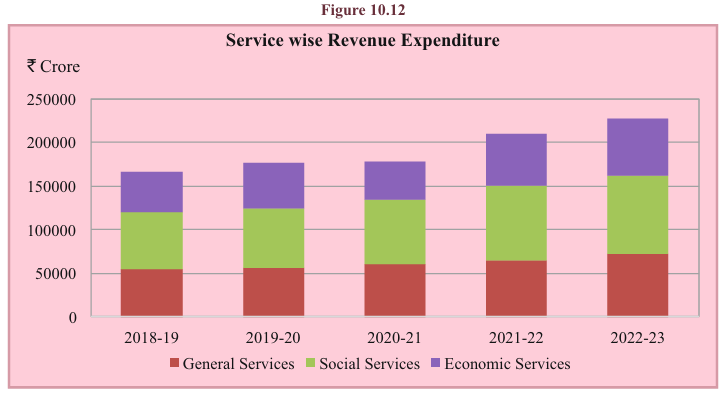
Analytical Summary
This bar graph illustrates the changes in service-wise revenue expenditure from 2018-19 to 2022-23, highlighting three main sectors: General Services, Social Services, and Economic Services. The total revenue expenditure consistently increased over this period, reflecting the government’s growing focus on both social welfare and economic development.
Key Data Points
- General Services:
- 2018-19: ₹ 54,364 crore
- 2022-23: ₹ 71,875 crore
- Social Services:
- 2018-19: ₹ 65,687 crore
- 2022-23: ₹ 90,168 crore
- Economic Services:
- 2018-19: ₹ 46,722 crore
- 2022-23: ₹ 64,436 crore
- Total Revenue Expenditure:
- 2018-19: ₹ 1,66,773 crore
- 2022-23: ₹ 2,26,479 crore
Key Observations
- Increase in Total Revenue Expenditure: There has been a steady rise in total revenue expenditure over the five years, from ₹ 1,66,773 crore in 2018-19 to ₹ 2,26,479 crore in 2022-23.
- Growth in Social Services Expenditure: Social Services consistently accounted for the largest share of the expenditure, increasing from ₹ 65,687 crore to ₹ 90,168 crore, reflecting the government’s priority in health, education, and social welfare programs.
- Steady Growth in Economic Services: Economic Services also saw an increase, indicating the government’s efforts to support infrastructure development and economic initiatives.
- Stable Allocation to General Services: While General Services saw an increase in expenditure, its relative share remained consistent, hovering around 31-32% of total expenditure.
Key Terms
- General Services: Government expenditures on administration, defense, and law enforcement.
- Social Services: Expenditures on sectors such as health, education, and welfare programs.
- Economic Services: Investments in infrastructure, agriculture, and industrial development aimed at boosting economic growth.
Key Insights
- Social Welfare Focus: The government has consistently increased its spending on social services, which shows its strong focus on welfare programs aimed at improving public health, education, and social safety nets.
- Balanced Expenditure: The expenditure is balanced across all three categories, with a stable share for general services and growing attention to both economic and social development, indicating a comprehensive approach to governance.
- Investment in Economic Growth: Increasing economic services expenditure highlights the government’s efforts to build infrastructure and boost sectors crucial for long-term economic stability.
Conclusion
The data shows a balanced and consistent increase in the government’s revenue expenditure across all major sectors. While social services receive the highest priority, economic services also get significant attention, reflecting a dual focus on welfare and growth. The stable yet rising allocation to General Services ensures that administrative and regulatory functions are maintained. The upward trend in spending across the board indicates a sustainable growth trajectory, with the government focusing on both immediate social needs and long-term economic development.
Table 10.3

Analytical Summary
This table provides a detailed breakdown of development expenditure from 2018-19 to 2022-23, highlighting key areas such as Social Services and Economic Services. It also tracks total developmental expenditure as a percentage of total government expenditure, demonstrating the government’s focus on growth and development activities over the years. The table excludes the UDAY scheme’s impact on recent years, which affects the overall development expenditure calculation for 2020-21 and beyond.
Key Data Points
- Social Services Expenditure:
- 2018-19: ₹ 72,836 crore
- 2022-23: ₹ 99,019 crore
- Economic Services Expenditure:
- 2018-19: ₹ 59,736 crore
- 2022-23: ₹ 75,016 crore
- Total Developmental Expenditure:
- 2018-19: ₹ 1,32,572 crore
- 2022-23: ₹ 1,74,035 crore
- Development Expenditure as a Percentage of Total Expenditure:
- 2018-19: 70.7%
- 2022-23: 70.6%
Key Observations
- Significant Increase in Social Services Expenditure: Expenditure on social services saw consistent growth, increasing from ₹ 72,836 crore in 2018-19 to ₹ 99,019 crore in 2022-23. This suggests a sustained investment in areas such as health, education, and welfare programs.
- Fluctuations in Economic Services Expenditure: While economic services expenditure initially declined in 2020-21, it rebounded strongly in the following years, reaching ₹ 75,016 crore in 2022-23. This indicates a renewed focus on infrastructure, industry, and economic growth.
- Overall Development Expenditure Growth: Total developmental expenditure rose from ₹ 1,32,572 crore in 2018-19 to ₹ 1,74,035 crore in 2022-23, reflecting the government’s increasing allocation towards developmental projects despite temporary declines.
- Stable Proportion of Development Expenditure: The percentage of development expenditure relative to total government expenditure remained relatively stable, hovering around 70-71%, showing that a significant portion of government spending is consistently directed towards developmental activities.
Key Terms
- Social Services: Investments made in sectors such as education, healthcare, and social welfare.
- Economic Services: Expenditures focused on stimulating economic activities, including infrastructure, agriculture, and industry.
- Developmental Expenditure: Government spending aimed at long-term growth and development, including social and economic services.
- UDAY Scheme: A financial restructuring program launched to revive power distribution companies (DISCOMs), which was included in earlier years’ expenditures but not in the later years.
Key Insights
- Emphasis on Social Welfare: The continuous growth in social services expenditure shows the government’s commitment to improving health, education, and social welfare, reflecting a strong focus on human development.
- Fluctuations in Economic Services: Economic services experienced a decline in 2020-21, possibly due to pandemic-related disruptions, but rebounded in subsequent years, indicating a recovery in government spending on economic infrastructure and growth initiatives.
- Stable Development Expenditure Proportion: The government has maintained a steady allocation of around 70% of its total expenditure towards developmental projects, reflecting a consistent policy focus on development.
Conclusion
The data shows a stable and increasing commitment to development-oriented expenditure, with social services receiving the most consistent increases. Despite temporary setbacks in economic services during 2020-21, government spending in this area rebounded, ensuring balanced development across both social and economic sectors. The development expenditure as a percentage of total expenditure remains consistent, indicating the government’s strategic focus on long-term growth and human development.
Table 10.4

Analytical Summary
This table provides a comparison of the approved outlay and actual expenditure of the schematic budget for the fiscal years 2017-18 through 2023-24. It reveals an increasing trend in both the approved outlay and the actual expenditure, indicating a significant rise in planned government spending over the years. This steady growth in outlay and expenditure reflects the government’s expanding developmental priorities and growing investment in various sectors.
Key Data Points
- Schematic Budget (2017-18):
- Approved Outlay: ₹ 81,157.97 crore
- Expenditure: ₹ 78,117.34 crore
- Schematic Budget (2022-23):
- Approved Outlay: ₹ 1,69,655.55 crore
- Expenditure: ₹ 1,48,192.26 crore*
- Schematic Budget (2023-24):
- Approved Outlay: ₹ 1,84,311.57 crore
- Expenditure: ₹ 1,58,714.39 crore# (Tentative, up to March 2024)
Key Observations
- Steady Increase in Approved Outlay: The approved outlay has seen a consistent increase each year, rising from ₹ 81,157.97 crore in 2017-18 to ₹ 1,84,311.57 crore in 2023-24. This growth reflects the government’s expanding fiscal plans.
- Expenditure Growth: Actual expenditure has also grown significantly, albeit with some differences from the approved outlay in certain years. For example, in 2022-23, the expenditure was ₹ 1,48,192.26 crore, which was lower than the approved outlay of ₹ 1,69,655.55 crore.
- Close Alignment Between Outlay and Expenditure: Generally, the actual expenditure is relatively close to the approved outlay, showing efficient budget utilization by the government.
- Sharp Increase in 2023-24: The projected expenditure for 2023-24 is tentatively set at ₹ 1,58,714.39 crore, indicating a further substantial increase compared to the previous years.
Key Terms
- Approved Outlay: The total amount allocated in the government’s budget for various projects and initiatives for a fiscal year.
- Expenditure: The actual spending incurred during the fiscal year.
- Schematic Budget: A detailed budget outlining the financial outlay for specific government schemes and projects.
- Tentative Expenditure: Projected expenditure that is subject to final adjustments by the end of the fiscal year.
Key Insights
- Increasing Government Investment: The significant rise in both the approved outlay and expenditure over the years highlights the government’s commitment to scaling up its investment in public infrastructure, social services, and other critical areas.
- Efficient Budget Utilization: The gap between approved outlay and actual expenditure is relatively narrow, suggesting efficient implementation of the planned projects and effective fiscal management.
- Rising Fiscal Ambitions: The rapid increase in outlay from ₹ 81,157.97 crore in 2017-18 to ₹ 1,84,311.57 crore in 2023-24 reflects growing ambitions in terms of public sector spending and developmental initiatives.
Conclusion
The consistent increase in both the approved outlay and expenditure underlines the expanding scope of government-led projects in the state, with a focus on sustained growth and development. While the gap between outlay and expenditure persists, it remains within manageable limits, indicating the government’s overall efficiency in utilizing budget allocations for development. The projections for 2023-24 suggest that the trend of rising investment will continue, signaling a positive outlook for public infrastructure and services.
Table 10.5
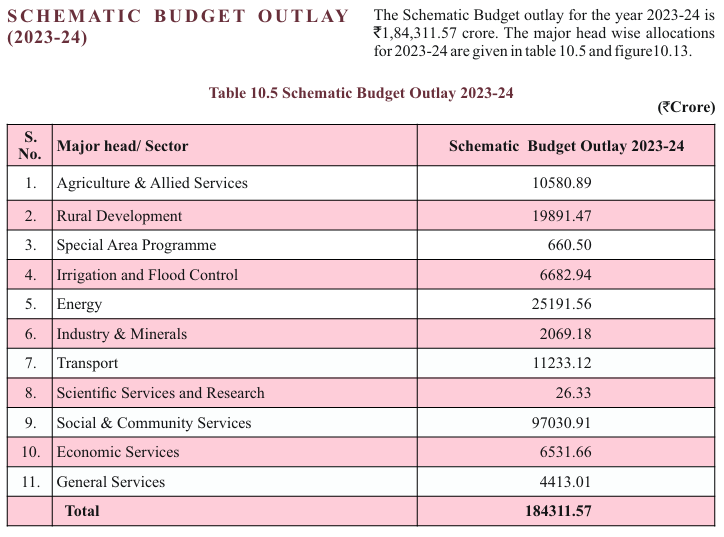
Analytical Summary
Table 10.5 provides an overview of the sector-wise allocation of the Schematic Budget Outlay for the financial year 2023-24. The total budgeted outlay is ₹ 1,84,311.57 crore, distributed across various sectors, with significant emphasis on Rural Development, Energy, and Social & Community Services. These sectors account for the largest shares of the total outlay, reflecting the government’s focus on essential infrastructure, welfare programs, and energy.
Key Data Points
- Total Outlay: ₹ 1,84,311.57 crore
- Rural Development: ₹ 19,891.47 crore
- Energy: ₹ 25,191.56 crore
- Social & Community Services: ₹ 97,030.91 crore
- Agriculture & Allied Services: ₹ 10,580.89 crore
- Transport: ₹ 11,233.12 crore
Key Observations
- Highest Allocations:
- Social & Community Services receives the highest allocation at ₹ 97,030.91 crore, emphasizing the importance of welfare schemes, healthcare, and education.
- Energy sector allocation stands at ₹ 25,191.56 crore, indicative of the government’s focus on energy infrastructure, possibly including renewable energy projects.
- Rural Development receives ₹ 19,891.47 crore, highlighting the prioritization of improving rural infrastructure and livelihoods.
- Significant Allocation to Transport:
- Transport has been allocated ₹ 11,233.12 crore, showcasing continued investment in improving connectivity and transportation infrastructure, which is essential for economic growth.
- Agriculture & Allied Services:
- Agriculture, a critical sector in India, has been allocated ₹ 10,580.89 crore, focusing on improving agricultural productivity, farmer support, and rural economy enhancement.
- Smaller Allocations:
- Special Area Programmes and Scientific Services and Research have smaller allocations at ₹ 660.50 crore and ₹ 26.33 crore, respectively, indicating their specific focus areas with targeted interventions.
Key Terms
- Schematic Budget Outlay: Refers to the budget specifically allocated for implementing government-approved plans and schemes.
- Rural Development: Programs and investments aimed at improving the quality of life and economic well-being in rural areas.
- Social & Community Services: Include programs related to healthcare, education, welfare, and community infrastructure.
- Economic Services: Involves government spending on economic infrastructure, businesses, and industry support.
Key Insights
- Prioritization of Social and Welfare Programs: The largest portion of the outlay goes toward Social & Community Services, underscoring the government’s commitment to public welfare, healthcare, and education. This is indicative of a broader policy focus on improving human development indicators.
- Energy Sector Focus: The substantial allocation to Energy highlights the government’s initiative to develop a robust energy infrastructure, possibly focusing on renewable energy sources and grid enhancements.
- Balanced Approach Toward Infrastructure: Sectors like Rural Development, Agriculture, and Transport have received significant allocations, reflecting a balanced investment in both rural upliftment and physical infrastructure.
- Relatively Lower Allocation for Scientific Services: While essential, Scientific Services and Research have received minimal budgetary outlay, suggesting that this area might be receiving support through specialized programs or external funding mechanisms.
Conclusion
The 2023-24 Schematic Budget Outlay reveals the government’s clear focus on sectors that drive economic growth, infrastructure development, and social welfare. The large allocations for Rural Development, Energy, and Social & Community Services point toward a policy agenda aimed at inclusive development and addressing key challenges such as rural poverty, infrastructure gaps, and energy needs. The budget reflects a commitment to long-term development goals while ensuring equitable growth across various sectors.
Figure 10.13
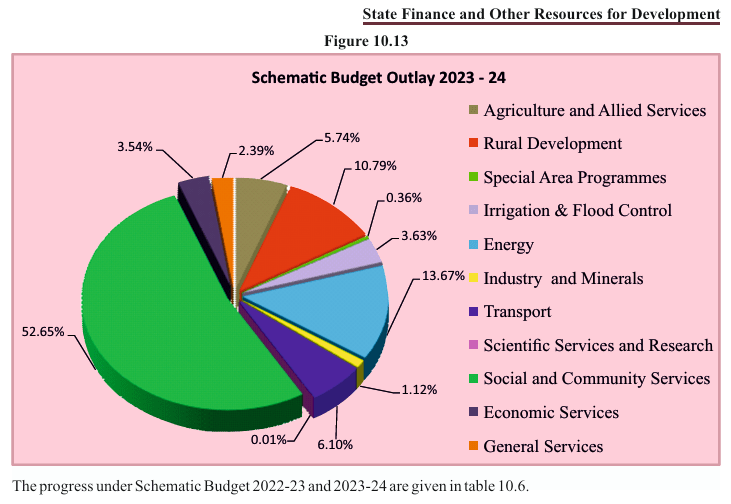
Analytical Summary
Figure 10.13 presents a pie chart representing the distribution of the Schematic Budget Outlay for the financial year 2023-24. The chart visually depicts the allocation of ₹1,84,311.57 crore across various sectors. The largest share is directed towards Social and Community Services, followed by Energy, Industry and Minerals, and Rural Development.
Key Data Points
- Social and Community Services: 52.65% (₹97,030.91 crore)
- Energy: 13.67% (₹25,191.56 crore)
- Industry and Minerals: 10.79% (₹20,691.18 crore)
- Rural Development: 5.74% (₹19,891.47 crore)
- Transport: 6.10% (₹11,233.12 crore)
- Agriculture and Allied Services: 5.74% (₹10,580.89 crore)
- Irrigation & Flood Control: 3.63% (₹6,682.94 crore)
- Economic Services: 3.54% (₹6,531.66 crore)
- General Services: 2.39% (₹4,413.01 crore)
- Special Area Programmes: 0.36% (₹660.50 crore)
- Scientific Services and Research: 0.01% (₹26.33 crore)
Key Observations
- Dominance of Social and Community Services:
- Over half of the budget (52.65%) is allocated to Social and Community Services, highlighting the state’s focus on human development initiatives, which include healthcare, education, welfare, and other social programs.
- Energy Sector Investment:
- The Energy sector receives the second-largest allocation at 13.67%, suggesting a substantial emphasis on improving energy infrastructure and potentially on renewable energy projects and ensuring energy security.
- Industry and Rural Development:
- A notable allocation to Industry and Minerals (10.79%) indicates a focus on industrial growth and employment generation.
- Rural Development accounts for 5.74% of the budget, showing continued support for enhancing rural infrastructure and livelihood improvement.
- Transport and Agriculture:
- Transport receives a significant 6.10%, reflecting ongoing infrastructure development projects aimed at improving connectivity.
- Agriculture & Allied Services at 5.74% underscores the importance of this sector to the state’s economy, providing funds to improve productivity, market access, and farmer support.
- Lower Allocation Sectors:
- Scientific Services and Research has a minimal allocation (0.01%), suggesting that it may rely on other funding mechanisms.
- Special Area Programmes (0.36%) and General Services (2.39%) have relatively smaller shares of the budget.
Key Terms
- Schematic Budget: A budget that outlines financial allocations across specific sectors, programs, or initiatives.
- Social and Community Services: Includes welfare programs, healthcare, education, and public infrastructure aimed at community development.
- Economic Services: Government expenditure on economic growth-promoting activities such as industry, commerce, and financial systems.
- General Services: Includes expenditure on government administration and related areas.
Key Insights
- Social Development Focus: The significant allocation to Social and Community Services indicates that the state government is focusing on improving healthcare, education, welfare schemes, and public health infrastructure, which are critical for long-term human capital development.
- Energy as a Key Priority: With energy being the second-highest allocation, it suggests the state’s focus on expanding energy access, likely improving electricity infrastructure and renewable energy projects.
- Balanced Infrastructure and Rural Growth: The distribution of funds across Rural Development, Transport, and Industry sectors reflects a balanced approach to strengthening rural and industrial infrastructure, with an emphasis on economic growth and connectivity.
- Modest Investment in Scientific Research: The low allocation to Scientific Services and Research may indicate either a lack of immediate focus on innovation-driven projects or reliance on alternative sources of funding such as national grants or private partnerships.
Conclusion
The budgetary allocations for 2023-24 reflect a clear commitment to social welfare and community development, with over 52% of the outlay directed towards Social and Community Services. There is also significant investment in energy and industry, suggesting a focus on economic revitalization and infrastructure development. The overall distribution showcases the government’s priority in addressing both immediate needs such as welfare, and long-term growth sectors such as energy and rural development. The balanced yet focused allocations are likely aimed at fostering inclusive growth and improving the quality of life across the state.
Table 10.6
Analytical Summary
Table 10.6 shows the progress under the schematic budget for the fiscal years 2022-23 (tentative expenditure) and 2023-24 (up to March 2024). It provides a breakdown of the major heads of expenditure across various sectors. The comparison between these two fiscal years highlights both increases and decreases in specific areas of expenditure, showcasing the government’s budgetary priorities.
Key Data Points
- Agriculture & Allied Services:
- 2022-23: ₹8450.48 crore
- 2023-24: ₹9883.90 crore
- Rural Development:
- 2022-23: ₹19188.86 crore
- 2023-24: ₹11772.16 crore
- Irrigation and Flood Control:
- 2022-23: ₹3535.08 crore
- 2023-24: ₹5226.76 crore
- Energy:
- 2022-23: ₹26341.94 crore
- 2023-24: ₹27696.29 crore
- Industry & Minerals:
- 2022-23: ₹1822.13 crore
- 2023-24: ₹1871.53 crore
- Transport:
- 2022-23: ₹7749.77 crore
- 2023-24: ₹11310.60 crore
- Social & Community Services:
- 2022-23: ₹72810.41 crore
- 2023-24: ₹79856.39 crore
- General Services:
- 2022-23: ₹5424.39 crore
- 2023-24: ₹6498.51 crore
- Grand Total:
- 2022-23: ₹148192.26 crore
- 2023-24: ₹158714.39 crore
Key Observations
- Agriculture & Allied Services saw an increase of approximately ₹1433 crore, reflecting a heightened focus on the agricultural sector.
- Rural Development experienced a significant drop of ₹7416.70 crore from the previous fiscal year, indicating a shift in budgetary focus away from this sector in 2023-24.
- Irrigation and Flood Control saw a notable rise of ₹1691.68 crore, suggesting an emphasis on water resource management and infrastructure.
- Energy continued to be a high-priority area, with an increase of around ₹1354 crore, emphasizing the ongoing investment in energy infrastructure.
- Transport saw a significant increase of approximately ₹3560 crore, indicating large-scale infrastructure projects aimed at improving transport facilities in the state.
- Social & Community Services maintained the highest allocation, increasing by around ₹7046 crore, underscoring the state’s commitment to social welfare programs.
- General Services saw an increase of ₹1074 crore, reflecting a growing emphasis on administrative and governance-related expenditures.
Key Terms
- Schematic Budget: A detailed breakdown of budget allocations across specific sectors or initiatives, often targeting development and welfare.
- Agriculture & Allied Services: Includes expenditure on farming, animal husbandry, fisheries, and other agriculture-related sectors.
- Rural Development: Focuses on initiatives aimed at improving rural infrastructure, livelihood, and overall development in rural areas.
- Irrigation and Flood Control: Investments aimed at water management, dam construction, and flood prevention measures.
- Social & Community Services: Encompasses spending on healthcare, education, social welfare, and related services for community development.
- General Services: Administrative costs related to governance and public administration.
Key Insights
- Focus on Social Services: Social and Community Services dominate the expenditure, receiving the highest allocation. This indicates a strong government commitment to social development, including health, education, and welfare programs.
- Rise in Transport and Energy Investments: The significant rise in Transport and Energy expenditures highlights the government’s focus on improving infrastructure to support industrial growth and meet energy demands.
- Reduced Emphasis on Rural Development: The substantial reduction in the allocation for Rural Development could indicate that key initiatives in this sector may have been completed or that attention has shifted to other areas like transport and energy infrastructure.
- Steady Growth in Agriculture: The increase in the agriculture budget shows a commitment to supporting farming and allied activities, likely responding to the sector’s critical role in the state’s economy.
Conclusion
The 2023-24 budget reflects a shift towards increased investment in infrastructure, particularly in the Energy, Transport, and Irrigation sectors. Social welfare remains a significant focus, with Social and Community Services receiving the largest share. The overall growth in budgetary allocations reflects the state’s strategy to balance economic growth with social development, ensuring a more sustainable and inclusive growth trajectory.
Table 10.7

Analytical Summary
Table 10.7 presents a detailed financial overview of externally aided projects in Rajasthan, reflecting their total project cost, expenditure during the year 2023-24, and the total expenditure since their inception up to March 2024. The projects span various sectors including urban development, highway infrastructure, and water sector improvement, with funding assistance from international agencies such as the Asian Development Bank (ADB), the World Bank, and the Japan International Cooperation Agency (JICA).
Key Data Points
- Rajasthan Urban Sector Development Program (Phase-III) (ADB):
- Total Project Cost: ₹4038.37 crore
- Expenditure in 2023-24: ₹322.75 crore
- Total Expenditure up to March 2024: ₹3513.34 crore
- Rajasthan Secondary Town Development Sector Project (Phase-IV) (Tranche-I) (ADB):
- Total Project Cost: ₹3076.63 crore
- Expenditure in 2023-24: ₹544.57 crore
- Total Expenditure up to March 2024: ₹1755.29 crore
- Rajasthan Secondary Town Development Sector Project (Phase-IV) (Tranche-II) (ADB):
- Total Project Cost: ₹2450.00 crore
- Expenditure in 2023-24: ₹387.69 crore
- Total Expenditure up to March 2024: ₹446.00 crore
- Rajasthan State Highway Investment Program-I (Tranche-II) (ADB):
- Total Project Cost: ₹2696.52 crore
- Expenditure in 2023-24: ₹455.21 crore
- Total Expenditure up to March 2024: ₹1566.64 crore
- Rajasthan State Highway Investment Program-I (Tranche-III) (ADB):
- Total Project Cost: ₹1172.94 crore
- Expenditure in 2023-24: ₹507.45 crore
- Total Expenditure up to March 2024: ₹550.41 crore
- Rajasthan State Highway Development Program-II (World Bank):
- Total Project Cost: ₹3513.34 crore
- Expenditure in 2023-24: ₹932.62 crore
- Total Expenditure up to March 2024: ₹2130.93 crore
- Rajasthan Water Sector Livelihood Improvement Project (JICA):
- Total Project Cost: ₹1069.40 crore
- Expenditure in 2023-24: ₹86.56 crore
- Total Expenditure up to March 2024: ₹793.41 crore
Key Observations
- The Rajasthan Urban Sector Development Program (Phase-III) is nearing completion, with a total expenditure of ₹3513.34 crore out of ₹4038.37 crore.
- The Rajasthan Secondary Town Development Sector Projects under Phase-IV, both Tranche-I and Tranche-II, show substantial progress, with Tranche-I already reaching more than half of its total project cost.
- The Rajasthan State Highway Investment Program is making consistent financial progress with both Tranche-II and Tranche-III showing steady annual expenditure.
- The Rajasthan State Highway Development Program-II, backed by the World Bank, is the largest highway-related project, with significant annual expenditure and over ₹2130.93 crore spent so far.
- The Rajasthan Water Sector Livelihood Improvement Project (JICA) has also made substantial progress with nearly 75% of its total budget spent.
Key Terms
- ADB (Asian Development Bank): A regional development bank that provides loans and technical assistance to promote social and economic development in Asia.
- World Bank: An international financial institution that provides loans and grants to the governments of poorer countries for the purpose of pursuing capital projects.
- JICA (Japan International Cooperation Agency): A governmental agency that coordinates official development assistance for the government of Japan, promoting economic growth and sustainable development.
- Tranche: A portion of a larger loan or funding agreement disbursed over time.
- Expenditure: Refers to the amount of money spent or allocated for specific projects within a given period.
Key Insights
- Priority on Urban and Infrastructure Development: The majority of these externally aided projects focus on urban sector development, secondary town development, and highway investment, indicating that the state prioritizes infrastructure improvements to support urbanization and connectivity.
- Highway Development: The state’s partnership with ADB and the World Bank for highway development highlights the significance of improving transport networks to boost economic activities.
- Ongoing Projects with Significant Progress: Most of the projects have seen substantial progress, with many nearing 50% or more of their total budget spent. This suggests that the projects are on track, though some projects may require faster execution to meet completion deadlines.
- Balanced Focus on Water Sector: The inclusion of the water sector project indicates an integrated approach to enhancing both infrastructure and livelihoods, particularly in rural areas.
Conclusion
The ongoing externally aided projects in Rajasthan reflect a robust collaboration with international financial institutions, focusing on critical sectors like urban development, highway infrastructure, and water management. The financial progress shows effective utilization of the allocated funds, with most projects seeing significant expenditure in 2023-24. The state’s balanced focus on urban infrastructure, transport, and rural livelihood improvement highlights a comprehensive development strategy aimed at fostering economic growth and sustainable development across sectors.
Table – Financial Overview of Ongoing
Externally Aided Projects (Part 2)
Analytical Summary
This section provides an overview of externally funded projects related to water sector restructuring, green energy, public financial management, rural water supply, dam rehabilitation, and forestry. These projects are supported by a variety of international agencies including the New Development Bank (NDB), KfW (German Development Bank), the World Bank, JICA, and AFD (French Development Agency). The table provides details on the total project costs, the expenditure during the fiscal year 2023-24, and the cumulative expenditure since inception up to March 2024.
Key Data Points
- Rajasthan Water Sector Restructuring Project for Desert Areas – Tranche I, II (NDB):
- Total Project Cost: ₹3291.63 crore
- Expenditure in 2023-24: ₹657.03 crore
- Total Expenditure up to March 2024: ₹2314.84 crore
- Intra-State Transmission System Green Energy Corridor – II (KFW):
- Total Project Cost: ₹1022.79 crore
- Expenditure in 2023-24: ₹0.00 crore
- Total Expenditure up to March 2024: ₹0.00 crore (project yet to be initiated financially)
- Strengthening Public Financial Management in Rajasthan (World Bank):
- Total Project Cost: ₹244.53 crore
- Expenditure in 2023-24: ₹36.79 crore
- Total Expenditure up to March 2024: ₹221.11 crore
- Rajasthan Rural Water Supply & Fluorosis Mitigation Project Phase-II (JICA):
- Total Project Cost: ₹4765.31 crore
- Expenditure in 2023-24: ₹0.40 crore
- Total Expenditure up to March 2024: ₹0.40 crore (project recently started)
- Dam Rehabilitation and Improvement Project-II (World Bank):
- Total Project Cost: ₹503.02 crore
- Expenditure in 2023-24: ₹37.87 crore
- Total Expenditure up to March 2024: ₹128.43 crore
- Rajasthan Forestry & Biodiversity Development Project (AFD):
- Total Project Cost: ₹1693.91 crore
- Expenditure in 2023-24: ₹68.15 crore
- Total Expenditure up to March 2024: ₹68.15 crore
Key Observations
- Rajasthan Water Sector Restructuring Project for Desert Areas: The largest ongoing project in this section, it has already incurred substantial expenditure of ₹2314.84 crore, making notable progress toward its completion.
- Intra-State Transmission System Green Energy Corridor: Despite having a total project cost of ₹1022.79 crore, there has been no expenditure recorded for 2023-24, indicating that the project might still be in the planning or initial phases.
- Rural Water Supply & Fluorosis Mitigation Project (JICA): While a significant project with a total cost of ₹4765.31 crore, this initiative has just begun with minimal expenditure of ₹0.40 crore so far, suggesting early-stage implementation.
- Public Financial Management and Dam Rehabilitation Projects: These World Bank-funded projects have both made steady progress, with cumulative expenditures reflecting their ongoing development.
- Forestry & Biodiversity Development Project (AFD): This project has also seen a significant expenditure of ₹68.15 crore in its first year, indicating strong implementation efforts.
Key Terms
- NDB (New Development Bank): An international financial institution established by the BRICS countries (Brazil, Russia, India, China, and South Africa) to support infrastructure and sustainable development projects.
- KFW (Kreditanstalt für Wiederaufbau): A German government-owned development bank that provides loans and financial assistance for development projects.
- AFD (Agence Française de Développement): A French public financial institution that funds projects that contribute to sustainable development, especially in developing countries.
- PPP (Public-Private Partnership): A cooperative arrangement between public and private sectors for the financing, designing, implementing, and operating of projects and services.
Key Insights
- Focus on Water Resource Management: The significant allocations and expenditures for water restructuring and mitigation projects indicate Rajasthan’s priority to address water scarcity, particularly in desert areas, and tackle issues such as fluorosis, which is a public health concern in rural areas.
- Energy and Infrastructure Development: The emphasis on green energy transmission systems reflects Rajasthan’s effort to integrate renewable energy into its infrastructure, although financial disbursement for this project is yet to begin.
- Public Financial Management: The ongoing World Bank project focusing on financial management indicates efforts to improve fiscal governance and institutional capacity in the state.
- Environmental Focus: Projects like forestry and biodiversity development underline the state’s increasing focus on environmental conservation, supported by international funding.
Conclusion
The financial overview of these externally aided projects reflects a broad commitment to addressing critical areas such as water resource management, green energy, fiscal governance, and biodiversity in Rajasthan. The varied sources of international funding from NDB, KfW, JICA, and AFD demonstrate the state’s ability to attract global partnerships for its development initiatives. Although some projects are still in the early stages, the substantial progress in water and dam rehabilitation projects signals effective utilization of resources aimed at fostering long-term sustainability and infrastructure growth.
Table 10.8

Analytical Summary
This table presents an overview of Public-Private Partnership (PPP) projects across various sectors in Rajasthan, highlighting the number of completed projects, projects under implementation, and those in the planning or pipeline stage, along with their corresponding financial outlays (in ₹ crore). The sectors include roads, urban infrastructure, power, water, IT, social, and others, indicating the state’s multifaceted approach to infrastructure development through partnerships with private entities.
Key Data Points
- Roads (State Highways & National Highways):
- Completed Projects: 75 projects worth ₹8888.61 crore
- Under Implementation: 10 projects worth ₹2469.91 crore
- Urban Infrastructure:
- Completed Projects: 28 projects worth ₹561.37 crore
- Under Implementation: 9 projects worth ₹516.97 crore
- In Pipeline: 17 projects with an estimated value of ₹7056.45 crore
- Power:
- Completed Projects: 15 projects worth ₹7449.37 crore
- Under Implementation: 5 projects worth ₹1005.45 crore
- In Pipeline: 4 projects with an estimated value of ₹1631.92 crore
- Water:
- Completed Projects: 1 project worth ₹46 crore
- In Pipeline: 1 project with an estimated value of ₹365 crore
- IT:
- Completed Projects: 1 project worth ₹54.01 crore
- Social:
- Completed Projects: 61 projects worth ₹624.87 crore
- Under Implementation: 4 projects worth ₹18.27 crore
- In Pipeline: 5 projects with an estimated value of ₹747.53 crore
- Others:
- Completed Projects: 16 projects worth ₹166.36 crore
- Under Implementation: 2 projects worth ₹18.27 crore
- In Pipeline: 2 projects with an estimated value of ₹1708 crore
Key Observations
- Roads (State Highways and National Highways): This sector dominates the PPP landscape, with the largest number of completed projects (75) and the highest financial outlay for completed projects (₹8888.61 crore).
- Urban Infrastructure: The largest sector in terms of projects in the planning stage, with 17 upcoming projects valued at ₹7056.45 crore, indicating future expansion and development.
- Power Sector: The third largest sector, showing significant activity with both completed and ongoing projects. Additionally, new projects worth ₹1631.92 crore are in the pipeline.
- Water Sector: Though currently limited in terms of completed projects, there is a significant pipeline project worth ₹365 crore, reflecting the state’s focus on water infrastructure.
- Social Projects: This sector has seen the highest number of completed projects (61), albeit with relatively smaller financial outlays, indicating focus on smaller-scale social development initiatives.
Key Terms
- PPP (Public-Private Partnership): A cooperative arrangement between public and private sectors for the provision of public infrastructure or services.
- Under Implementation: Refers to projects that are currently in the development or construction phase.
- In Pipeline: Projects that are still in the planning phase or under negotiation but have not yet commenced.
Key Insights
- Infrastructure Development: Roads, urban infrastructure, and power dominate the PPP project landscape in Rajasthan, suggesting that the state is focusing on large-scale infrastructure development through private partnerships.
- Growth in Urban Infrastructure: The substantial number of urban infrastructure projects in the pipeline reflects a strong focus on urban development and modernization, with a significant financial commitment of over ₹7056 crore.
- Diverse Sectoral Investment: Although roads, power, and urban infrastructure are prioritized, there is a growing emphasis on social sector projects, particularly those with smaller budgets, reflecting the government’s balanced approach to both hard and soft infrastructure development.
- Water Sector Potential: While currently underrepresented, the pipeline project in the water sector could mark an important shift towards addressing water scarcity and infrastructure, a critical need in the arid regions of Rajasthan.
Conclusion
The table reveals the Rajasthan government’s strategic use of PPP models to accelerate development across key sectors such as roads, urban infrastructure, and power. With substantial projects under planning, particularly in urban and power infrastructure, the state’s long-term vision appears to focus on improving essential services while encouraging private sector participation. As more projects move from the pipeline to the implementation stage, sectors like water and urban development will likely see rapid expansion, contributing to the overall socio-economic development of the state.