CHAPTER 2
Agriculture plays a pivotal role in Rajasthan’s economy, serving as the backbone for a large segment of the population. Despite the state’s arid and semi-arid conditions, agriculture and allied sectors—comprising crop cultivation, livestock, forestry, and fisheries—remain a vital source of livelihood. However, the state’s agriculture is heavily rain-fed, making it highly vulnerable to the unpredictability of monsoons and water scarcity. Rajasthan’s unique geographical and climatic conditions, including irregular rainfall, declining groundwater levels, and a short monsoon season, present significant challenges to sustaining agricultural productivity.
In recent years, there has been a structural shift within the agricultural sector, with increasing contributions from livestock and allied activities. The state’s agricultural landscape is also characterized by growing diversification into high-value crops, while livestock farming has emerged as a reliable income source in the face of climate variability. This chapter provides an in-depth analysis of the performance and trends within the agriculture and allied sectors, examining key metrics such as Gross State Value Added (GSVA), sectoral growth rates, and production patterns. It also highlights the importance of government interventions and schemes aimed at supporting the agricultural economy, improving productivity, and addressing the ongoing challenges of climate adaptation and resource management.
Through this analysis, Chapter 2 aims to offer a comprehensive understanding of how agriculture continues to shape Rajasthan’s economy, while also exploring the future opportunities and risks faced by the sector in a changing environmental and economic landscape.
- Agriculture’s Role in Rajasthan’s Economy
- Agriculture and allied sectors play a crucial role in Rajasthan’s economy, employing a significant portion of the population. Despite being a state with largely arid and semi-arid conditions, it remains a vital economic sector. However, the state’s agriculture is heavily dependent on monsoons, and the unpredictable nature of rainfall—late onset, early withdrawal, and low average precipitation—poses significant risks.
- Despite these challenges, the Gross State Value Added (GSVA) from agriculture has seen growth. Between 2019-20 and 2023-24, GSVA increased from ₹1.76 lakh crore to ₹2.05 lakh crore at constant (2011-12) prices, representing a 3.86% Compound Annual Growth Rate (CAGR). At current prices, the GSVA rose from ₹2.61 lakh crore to ₹3.82 lakh crore, reflecting a higher 9.99% CAGR.
- Objective Insight: This significant difference between growth at constant and current prices suggests that inflation and increased commodity prices have driven a substantial part of the nominal growth, while real productivity improvements have been slower.
- Sectoral Composition of Agriculture and Allied Sectors
- The share of agriculture in Rajasthan’s GSVA has steadily declined, dropping from 28.56% in 2011-12 to 26.72% in 2023-24. This indicates a gradual structural shift in the economy, with other sectors like services and industry gaining relative importance.
- Sub-sectors within agriculture have the following shares:
- Crops: 44.53%
- Livestock: 48.58%
- Forestry & Logging: 6.40%
- Fishing: 0.49%
- Objective Insight: The dominance of livestock over crops highlights a key characteristic of Rajasthan’s agriculture. Livestock production, especially milk, eggs, and meat, provides a buffer against erratic rainfall and water scarcity, making it a more reliable income source in the state’s dry climate.
- Sub-sectors within agriculture have the following shares:
- Growth Trends and Sectoral Performance
- Overall Growth: The agriculture sector grew by 2.13% in 2023-24 over 2022-23 at constant prices. However, individual sub-sectors have shown varied performance:
- Crops: Declined by -1.61%, reflecting challenges in crop production due to unpredictable rainfall and water scarcity.
- Livestock: Grew by 5.83%, confirming its resilience and growing importance in the agricultural economy.
- Forestry & Logging: Grew by 2.82%, while fishing witnessed robust growth of 15.21%.
- Objective Insight: The negative growth in the crop sector contrasts sharply with the livestock sector’s strong performance. This suggests that livestock production is becoming increasingly important for mitigating agricultural risks, while the crop sector’s vulnerability to climate variability is causing stagnation.
- Key Crops and Their Contributions
- Crop Sector: The Gross State Value Added (GSVA) for the crop sector in 2023-24 stood at ₹1.70 lakh crore at current prices. Major crops in Rajasthan include:
- Kharif Crops: Bajra (pearl millet), groundnut, and moong (green gram).
- Rabi Crops: Wheat, mustard, and gram.
- Production Trends (as of 2023-24):
- Bajra: ₹9,041 crore
- Groundnut: ₹12,762 crore
- Wheat: ₹28,176 crore
- Mustard: ₹32,819 crore
- Objective Insight: Rajasthan remains one of India’s largest producers of bajra, mustard, and wheat, demonstrating its specialization in dryland crops. However, the performance of kharif crops is more volatile due to dependence on monsoon rains, as seen in fluctuating outputs across years.
- Livestock Sector: Rajasthan’s Strength
- The livestock sector in 2023-24 accounted for ₹1.85 lakh crore at current prices. It is dominated by:
- Milk: Contributing 80.64% of livestock income.
- Meat (including poultry): 12.38%.
- Eggs: 6.35%.
- Objective Insight: Rajasthan’s livestock sector is a crucial stabilizer in its agricultural economy. Milk, a primary product, is especially significant, and its large contribution reflects Rajasthan’s extensive cattle and buffalo population. Given the state’s water challenges, livestock production offers a more sustainable agricultural model than crop cultivation.
- Land Utilization and Fragmentation
- Land Use in Rajasthan (2022-23):
- Forest Area: 8.09% of the total reported area (27.73 lakh hectares).
- Net Area Sown: 53.74% (184.23 lakh hectares).
- Barren & Unculturable Land: 6.89% (23.62 lakh hectares).
- Operational Land Holdings: The Agriculture Census 2015-16 indicates that land fragmentation is increasing:
- Marginal holdings (less than 1 hectare): 40.12% of total holdings, with a 22.30% increase in number from 2010-11 to 2015-16.
- Large holdings (above 10 hectares): Only 4.69% of total holdings, with an 11.14% decline.
- Objective Insight: The increasing number of marginal and small landholdings and the decline in large holdings reflect a continuing trend of land fragmentation, which is partly driven by population growth and family divisions. This poses challenges for agricultural productivity, as smaller farms often struggle with mechanization, irrigation, and economies of scale.
- Monsoon and Its Impact
- Rajasthan’s agriculture is highly dependent on monsoons. In 2023, the state experienced 14.69% above-average rainfall (499.60 mm vs. normal 435.60 mm). However, the onset of the monsoon was delayed by 10 days.
- Objective Insight: While above-average rainfall is beneficial, its uneven distribution and delayed onset create challenges for crop planning and productivity. Kharif crops, in particular, are vulnerable to such disruptions, as reflected in the declining production of food grains during the kharif season.
- Agricultural Production Trends
- Food Grain Production in 2023-24 is projected at 245.01 lakh tonnes, a 3.08% decline from the previous year (252.80 lakh tonnes).
- Kharif Food Grains: Declined by 18.04%, highlighting the impact of delayed and irregular rainfall.
- Rabi Food Grains: Increased by 8.37%, compensating for some of the losses in kharif production.
- Objective Insight: The rabi crop’s resilience to climatic variability underscores the importance of water-efficient and drought-resistant crops like wheat and mustard, which perform better in the state’s arid conditions.
- Comparative Performance of Rajasthan in National Crop Production
- Rajasthan ranks first in India in the production of:
- Bajra (38.98% of India’s production)
- Rape & Mustard (46.63%)
- Guar (87.69%)
- It also ranks second in groundnut (16.83%) and third in gram (19.28%).
- Objective Insight: Rajasthan’s specialization in these crops, particularly dryland and oilseed crops, positions it as a leader in certain national agricultural outputs. The state’s success in mustard production is notable and reflects its comparative advantage in oilseeds.
- Government Initiatives and Schemes
- Several government schemes support agriculture in Rajasthan, including:
- Mukhyamantri Beej Swavalamban Yojana: Promoting quality seed production.
- National Food Security Mission (NFSM): Improving the production of food grains and pulses through technological interventions.
- Pradhan Mantri Fasal Bima Yojana (PMFBY): Providing crop insurance to protect against losses due to weather variability.
- Objective Insight: These initiatives aim to mitigate the risks associated with Rajasthan’s rain-fed agriculture and promote more sustainable farming practices, particularly through improved seeds, irrigation, and insurance coverage.
Objective Insight
- Sectoral Transition: While agriculture continues to be a key contributor, the declining percentage of crops (44.53% of GSVA) and increasing reliance on livestock (48.58%) indicates a transition towards mixed farming systems and the growing importance of animal husbandry.
- Land Fragmentation: The sharp decline in landholding sizes poses challenges for mechanization and economies of scale, which could affect long-term agricultural productivity unless counteracted by cooperative farming or consolidation initiatives.
- Rain-fed Agriculture: The over-reliance on monsoons, compounded by erratic rainfall patterns, highlights the need for irrigation infrastructure expansion. The state’s groundwater depletion is a significant risk for agricultural sustainability.
- Livestock Growth: The 5.83% growth in the livestock sector showcases the state’s shift towards more resilient agricultural practices, which are less dependent on rainfall and have a lower environmental footprint compared to crop farming.
- Government Intervention: The extensive range of government schemes underlines a proactive effort to improve agricultural resilience and productivity through improved seeds, technology dissemination, and financial support.
- Horticulture and Allied Activities: The growth of horticulture, along with strong performances in fruits, vegetables, and spices, shows potential diversification. Increased focus on post-harvest management, agro-processing, and exports could boost this sector further.
Conclusion
Rajasthan’s agriculture sector is both vital and vulnerable, reflecting a complex mix of challenges and opportunities. The following points offer an in-depth conclusion:
- Agriculture’s Critical Role in the Economy
- Agriculture and allied sectors remain the backbone of Rajasthan’s economy, employing a significant portion of the rural population. Despite challenges such as erratic rainfall, groundwater depletion, and limited irrigation, the sector continues to contribute significantly to the Gross State Value Added (GSVA), accounting for 26.72% in 2023-24.
- Water Scarcity and Rain-fed Agriculture
- Rajasthan’s agriculture is predominantly rain-fed, making it highly dependent on the monsoon. While the 2023 monsoon brought 14.69% more rainfall than average, the delayed onset and irregular distribution negatively affected kharif crop productivity.
- The groundwater depletion further exacerbates the water crisis, particularly affecting crop production, limiting the scope of irrigation, and making farmers vulnerable to droughts.
- Takeaway: Rajasthan needs stronger focus on water management, including irrigation improvements, rainwater harvesting, and drought-resistant crop varieties to mitigate its reliance on unpredictable rainfall.
- Shift from Crops to Livestock
- Over the years, the contribution of livestock to the agricultural sector has increased, accounting for 48.58% of GSVA within agriculture and allied sectors in 2023-24. This shift is due to the resilience of livestock farming against climatic uncertainties, unlike the crop sector, which showed a decline in production in recent years.
- Milk production alone contributes over 80% to livestock income, reinforcing Rajasthan’s dominance in dairy farming, supported by large cattle and buffalo populations.
- Takeaway: The expansion of livestock production provides Rajasthan a buffer against climate-related agricultural risks. Promoting livestock, especially dairy and poultry, offers an avenue for income diversification and rural economic stability.
- Sectoral Growth Trends: Livestock Resilience vs. Crop Volatility
- The overall agriculture sector witnessed a 2.13% growth in 2023-24 at constant prices, with contrasting performances across sub-sectors:
- Livestock: A robust 5.83% growth underlines its increasing importance in Rajasthan’s rural economy.
- Crops: A negative growth rate of -1.61% highlights the vulnerability of traditional farming to climatic shocks.
- Takeaway: A diversified agricultural strategy that emphasizes livestock and horticulture can help reduce income volatility in Rajasthan’s largely rain-dependent crop sector.
- Agricultural Production and Productivity Challenges
- Rajasthan’s food grain production in 2023-24 is expected to decline by 3.08% compared to the previous year, particularly due to a steep 18.04% drop in kharif grain output. However, the rabi grain production compensated, showing an 8.37% increase.
- Oilseeds and pulses, vital crops for the state, saw mixed results, with oilseed production slightly declining and pulses production showing both increases and decreases across seasons.
- Takeaway: Addressing productivity gaps through improved technology, better irrigation infrastructure, and climate-resilient agricultural practices is crucial to stabilizing production levels, particularly for kharif crops.
- Land Fragmentation and Its Impacts on Productivity
- Increasing land fragmentation is a major concern. The number of marginal holdings (below 1 hectare) grew by 22.30% from 2010-11 to 2015-16, while large holdings (above 10 hectares) declined by 11.14%. This leads to operational inefficiencies, as smaller farms struggle to adopt modern farming practices.
- Takeaway: There is a pressing need for land reforms that promote land consolidation, along with policies encouraging cooperative farming to make small-scale farming more viable.
- Government Initiatives and Support
- Various government schemes, such as the National Food Security Mission (NFSM), Pradhan Mantri Fasal Bima Yojana (PMFBY), and Mukhyamantri Beej Swavalamban Yojana, provide critical support in the form of subsidies, insurance, and improved seeds. These programs help mitigate agricultural risks and promote productivity, particularly in sectors like pulses and wheat.
- Takeaway: Continued and enhanced support for irrigation, crop insurance, and technology dissemination is needed to uplift marginal and small farmers and ensure sustained productivity growth.
- Potential of Horticulture and Agri-Business
- Horticulture presents a significant growth area for Rajasthan, with government initiatives aiming to expand production of fruits, vegetables, and spices. By investing in agri-business, Rajasthan can promote value-added processing, which will not only diversify the rural economy but also create employment.
- Takeaway: Expanding into horticulture and agro-processing industries will diversify Rajasthan’s agricultural output, reduce reliance on traditional crops, and create new income opportunities.
- Comparative Advantage in Select Crops
- Rajasthan leads in the production of bajra, mustard, guar, and oilseeds, contributing a significant share to India’s total production. This gives the state a clear comparative advantage in dryland crops suited to its arid climate.
- Takeaway: Capitalizing on Rajasthan’s natural advantage in certain crops, especially oilseeds and millet, through market expansion and better price realization, can further boost the state’s agricultural income.
- Monsoon Variability and Climate Adaptation
- Given Rajasthan’s dependence on the erratic monsoon for crop production, it is crucial to adopt climate-resilient practices. Increasing use of drought-resistant seeds, expanding micro-irrigation, and rainwater harvesting will help mitigate the risks associated with climate change.
- Takeaway: Long-term climate adaptation strategies, such as improving water efficiency and promoting drought-tolerant crops, will be key to safeguarding Rajasthan’s agricultural future.
Final Thoughts
Rajasthan’s agriculture and allied sectors are facing a critical transition phase. While the state remains an agricultural powerhouse in India, with strengths in livestock and dryland crops, it is also grappling with water scarcity, land fragmentation, and climate variability. The shift toward livestock, combined with a focus on sustainable agriculture, can help stabilize income, reduce risk, and promote long-term agricultural growth. With continued government support and investment in water management and technology, Rajasthan can overcome its challenges and continue its economic progress through agricultural innovation and diversification.
CHAPTER 2
Figure 2.1

Analytical Summary
This graph shows the Gross State Value Added (GSVA) and growth rates at both current and constant (2011-12) prices for the Agriculture and Allied Sectors in Rajasthan from 2019-20 to 2023-24. GSVA represents the value generated from the production of goods and services within the agriculture sector, and the growth rate indicates the annual percentage change.
Key Data Points
- Gross State Value Added (GSVA):
- Current Prices:
- 2019-20: ₹260,664 crore
- 2020-21: ₹292,644 crore
- 2021-22: ₹322,739 crore
- 2022-23: ₹348,011 crore
- 2023-24: ₹381,555 crore (Second Advance Estimates)
- Insight: The GSVA at current prices shows a consistent increase from ₹260,664 crore in 2019-20 to ₹381,555 crore in 2023-24, reflecting nominal growth in the agriculture sector over this period.
- Constant Prices (2011-12):
- 2019-20: ₹175,826 crore
- 2020-21: ₹186,902 crore
- 2021-22: ₹191,571 crore
- 2022-23: ₹200,313 crore
- 2023-24: ₹204,576 crore
- Insight: The GSVA at constant prices shows slower growth compared to current prices, with a rise from ₹175,826 crore in 2019-20 to ₹204,576 crore in 2023-24. This reflects real growth, adjusted for inflation, indicating modest increases in agricultural productivity.
- Current Prices:
- Growth Rate at Current Prices:
- 2019-20: 17.38%
- 2020-21: 12.27%
- 2021-22: 10.28%
- 2022-23: 7.83%
- 2023-24: 9.64%
- Insight: The growth rate at current prices shows a downward trend from a peak of 17.38% in 2019-20, declining to 7.83% in 2022-23. However, there is a slight recovery to 9.64% in 2023-24, indicating a renewed expansion of the agriculture sector in nominal terms.
- Growth Rate at Constant Prices (2011-12):
- 2019-20: 12.27%
- 2020-21: 6.30%
- 2021-22: 2.50%
- 2022-23: 4.56%
- 2023-24: 2.13%
- Insight: The growth rate at constant prices indicates slower real growth. After a significant drop from 12.27% in 2019-20 to 6.30% in 2020-21, the growth rate remains relatively low, reaching only 2.13% in 2023-24. This suggests that real agricultural productivity growth has slowed.
Key Observations
- Nominal vs. Real Growth:
- The GSVA at current prices is growing more rapidly than at constant prices, suggesting that a significant portion of the growth is due to inflation and rising prices rather than real increases in output or productivity. The real growth (adjusted for inflation) has slowed significantly in recent years, with the growth rate at constant prices falling to just 2.13% in 2023-24.
- Declining Growth Rates:
- The declining growth rates, especially at constant prices, point to a slowdown in the agriculture sector’s productivity. This could be due to various factors such as adverse weather conditions, supply chain disruptions, or structural challenges in the agriculture sector.
- Slight Recovery in 2023-24:
- While the real growth rate at constant prices remains low, there is a slight recovery in the nominal growth rate at current prices in 2023-24. This suggests that while real output is not growing significantly, the sector may be benefiting from price increases in agricultural products or other nominal factors.
Key Insights
- Inflation’s Role in Growth:
- The significant difference between the GSVA at current and constant prices highlights the role of inflation in driving nominal growth in the agriculture sector. Policymakers may need to focus on boosting real productivity to ensure sustainable growth rather than relying on price increases.
- Challenges to Agricultural Productivity:
- The low real growth rates suggest that the agriculture sector in Rajasthan may be facing challenges in terms of increasing productivity. These challenges could include factors like declining soil fertility, water scarcity, or inadequate infrastructure and technology in the agricultural sector.
- Policy Focus:
- Given the declining real growth in the agriculture sector, there may be a need for targeted policies to support agricultural productivity, including investments in modern agricultural practices, improved irrigation, and better market access for farmers.
Key Term
- Gross State Value Added (GSVA): The measure of the value of goods and services produced in an economy, in this case, the agriculture and allied sectors, adjusted for inflation when measured at constant prices.
Conclusion
The data highlights a steady increase in the nominal value of agricultural output in Rajasthan, but real growth has slowed significantly. While the GSVA at current prices continues to rise, much of this growth is due to inflation rather than real improvements in productivity. To ensure the long-term sustainability of the agriculture sector, there is a need for policies that focus on improving productivity and addressing structural challenges.
Figure 2.2
Analytical Summary
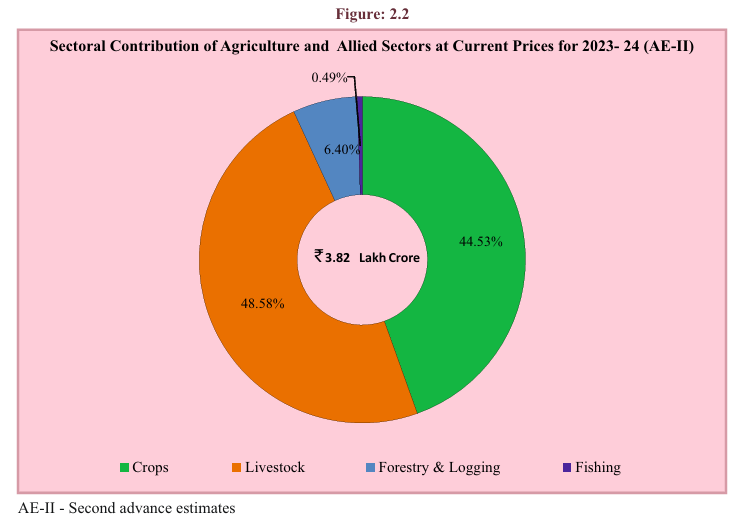
This chart represents the sectoral contribution of different sub-sectors within the Agriculture and Allied Sectors at current prices for 2023-24, based on Second Advance Estimates (AE-II). The total value of the sector is estimated at ₹3.82 lakh crore.
Key Sectoral Contributions
- Crops:
- Contribution: 44.53%
- Insight: The crops sector, which includes agriculture-related activities such as the cultivation of cereals, pulses, fruits, and vegetables, contributes nearly 44.53% to the total value of the agriculture and allied sectors. This indicates that crop cultivation remains a central part of the agricultural economy in Rajasthan.
- Livestock:
- Contribution: 48.58%
- Insight: Livestock, which includes dairy farming, poultry, and other animal husbandry activities, is the largest contributor, accounting for 48.58% of the sector. This highlights the importance of livestock farming in Rajasthan’s agricultural economy, surpassing crops in terms of economic value.
- Forestry & Logging:
- Contribution: 6.40%
- Insight: Forestry and logging activities contribute 6.40% to the total value of agriculture and allied sectors. This shows the role of forestry-related activities in rural livelihoods and environmental sustainability, although it represents a smaller portion of the sector compared to crops and livestock.
- Fishing:
- Contribution: 0.49%
- Insight: The fishing sector contributes 0.49%, making it the smallest component of the agriculture and allied sectors. While fishing plays a minor role in the state’s economy, it still provides livelihoods in regions with water bodies.
Key Observations
- Dominance of Livestock:
- The livestock sector’s contribution surpasses that of crops, accounting for nearly half (48.58%) of the total agriculture and allied sectors’ value. This suggests that animal husbandry and dairy production are critical to Rajasthan’s economy, likely due to the arid climate that may limit crop production in certain areas but is suitable for livestock farming.
- Significant Role of Crops:
- Despite being surpassed by livestock, crops still make up a substantial portion of the sector at 44.53%. This shows the ongoing importance of crop cultivation in the state, particularly in regions with favorable agricultural conditions.
- Minor Role of Forestry and Fishing:
- Forestry & Logging and Fishing together account for just under 7% of the sector’s total value. These sectors play a minor but essential role in the rural economy, contributing to biodiversity, resource management, and supplemental income for agricultural workers.
Key Insights
- Agricultural Diversification:
- The strong contribution from the livestock sector indicates that Rajasthan’s agricultural economy is diversified, relying heavily on livestock farming alongside traditional crop cultivation. This diversification could help the state mitigate risks associated with climatic variability and crop failures.
- Focus on Livestock Development:
- Given the large share of the livestock sector, there may be opportunities for further development in this area. Investments in animal health, productivity, and supply chain efficiency for livestock products (such as milk and meat) could have a substantial impact on rural incomes and overall economic growth.
- Sustainability in Forestry and Fishing:
- Although Forestry & Logging and Fishing have smaller economic contributions, they play a crucial role in ecological sustainability. Sustainable management of these sectors could support environmental goals while providing additional sources of income to rural populations.
Key Term
- Gross State Value Added (GSVA): The measure of the total value added by all economic sectors within a state, in this case, the agriculture and allied sectors, at current prices.
Conclusion
The chart highlights the importance of livestock and crops as the dominant contributors to Rajasthan’s agricultural economy, with livestock slightly ahead in terms of total value. While forestry and fishing play smaller roles, they remain essential components of the rural economy. The data suggests that future policy and investment strategies could focus on enhancing livestock productivity while maintaining the sustainability of forestry and fishing.
Figure 2.3
Analytical Summary
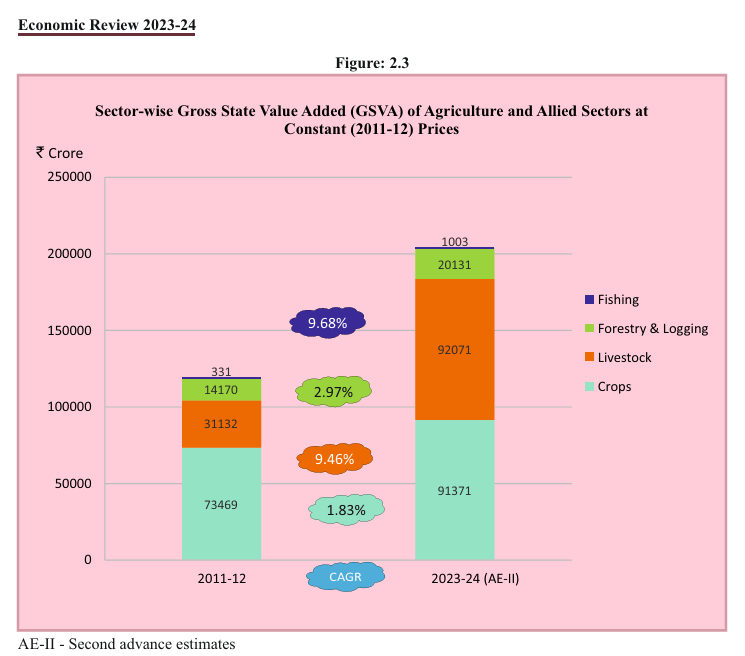
This chart shows the Gross State Value Added (GSVA) of various sub-sectors within the Agriculture and Allied Sectors at constant prices (2011-12) for the years 2011-12 and 2023-24 (Second Advance Estimates – AE-II). It also highlights the Compound Annual Growth Rate (CAGR) for each sector between these years, reflecting the long-term growth of these sectors.
Key Data Points (₹ Crore)
- Crops:
- 2011-12: ₹73,469 crore
- 2023-24: ₹91,371 crore
- CAGR: 1.83%
- Insight: The crop sector grew at a CAGR of 1.83%, increasing its GSVA from ₹73,469 crore in 2011-12 to ₹91,371 crore in 2023-24. This indicates a slow but steady growth in crop production over the period.
- Livestock:
- 2011-12: ₹31,132 crore
- 2023-24: ₹92,071 crore
- CAGR: 9.46%
- Insight: The livestock sector experienced significant growth, with its GSVA nearly tripling from ₹31,132 crore to ₹92,071 crore. The CAGR of 9.46% indicates that the livestock sector has been a major driver of growth in Rajasthan’s agricultural economy, making it one of the fastest-growing sub-sectors.
- Forestry & Logging:
- 2011-12: ₹14,170 crore
- 2023-24: ₹20,131 crore
- CAGR: 2.97%
- Insight: The forestry and logging sector saw moderate growth, with its GSVA increasing from ₹14,170 crore to ₹20,131 crore. The CAGR of 2.97% reflects stable growth, but at a slower pace compared to other sectors like livestock.
- Fishing:
- 2011-12: ₹331 crore
- 2023-24: ₹1,003 crore
- CAGR: 9.68%
- Insight: The fishing sector, though small in absolute value, grew significantly with a CAGR of 9.68%, increasing its GSVA from ₹331 crore to ₹1,003 crore. This rapid growth, although from a low base, shows the sector’s potential for further expansion.
Key Observations
- Livestock as a Major Growth Driver:
- The livestock sector shows the highest growth rate, with a CAGR of 9.46%, and its GSVA rose dramatically to ₹92,071 crore by 2023-24. This makes livestock the dominant contributor to Rajasthan’s agricultural economy, reflecting the state’s comparative advantage in animal husbandry.
- Modest Growth in Crops:
- The crop sector, despite being a large component of the GSVA, has grown at a relatively modest rate, with a CAGR of 1.83%. This suggests that crop production has faced challenges in terms of productivity or market growth compared to other sub-sectors.
- Forestry & Logging’s Moderate Growth:
- The forestry and logging sector grew at a CAGR of 2.97%, indicating steady but slow progress. This sector plays an important role in environmental sustainability, though its economic contribution is relatively limited.
- Rapid Growth in Fishing:
- The fishing sector, while small, has shown rapid expansion with a CAGR of 9.68%. This could be due to increasing investments in aquaculture, improvements in infrastructure, and rising demand for fisheries products.
Key Insights
- Diversification in Agriculture:
- The chart highlights the diversification of Rajasthan’s agricultural economy, with significant contributions from sectors beyond traditional crops, particularly livestock and fishing. This diversification helps the state mitigate risks associated with dependency on a single sector and promotes resilience against climate and market fluctuations.
- Livestock Sector Potential:
- The impressive growth of the livestock sector reflects its potential for further development. Rajasthan’s focus on dairy farming, animal husbandry, and other livestock-related activities has likely been a key driver of rural income growth. Further investments in this sector could lead to even greater contributions to the state’s economy.
- Need for Crop Sector Development:
- The relatively slow growth in the crop sector suggests a need for focused policies to improve agricultural productivity, such as adopting modern farming practices, enhancing irrigation infrastructure, and increasing access to markets and technology for farmers.
- Opportunities in Fishing:
- Though small in scale, the fishing sector’s rapid growth highlights its potential as an emerging area for economic development. Expanding infrastructure, encouraging sustainable fishing practices, and promoting aquaculture could help this sector grow further and provide more livelihoods.
Key Term
- Compound Annual Growth Rate (CAGR): The mean annual growth rate of an investment or sector over a specified period of time longer than one year, expressed as a percentage.
Conclusion
The chart shows significant growth across various sub-sectors of Rajasthan’s agriculture and allied sectors, with livestock and fishing leading the way in terms of growth rates. While the crop sector remains important, its relatively slow growth indicates that there is room for improvement. The data underscores the importance of diversification in agriculture, with livestock and fishing playing increasingly important roles in the state’s economy.
Figure 2.4
Analytical Summary
This graph depicts the Gross Value of Output (GVO) for three major Kharif crops—Bajra, Groundnut, and Moong—at current prices from 2019-20 to 2023-24.
Key Data Points (₹ Crore)
- Bajra:
- 2019-20: ₹9,566 crore
- 2020-21: ₹8,823 crore
- 2021-22: ₹9,720 crore
- 2022-23: ₹12,173 crore
- 2023-24: ₹9,041 crore
- Insight: The GVO for Bajra shows a fluctuating trend, peaking at ₹12,173 crore in 2022-23 before declining to ₹9,041 crore in 2023-24. This volatility may be attributed to variations in production levels, market demand, and price fluctuations.
- Groundnut:
- 2019-20: ₹6,996 crore
- 2020-21: ₹9,401 crore
- 2021-22: ₹8,762 crore
- 2022-23: ₹11,386 crore
- 2023-24: ₹12,762 crore
- Insight: Groundnut has shown consistent growth in output value, with the GVO rising from ₹6,996 crore in 2019-20 to ₹12,762 crore in 2023-24. The steady upward trend suggests strong market demand and favorable conditions for groundnut cultivation.
- Moong:
- 2019-20: ₹8,105 crore
- 2020-21: ₹8,983 crore
- 2021-22: ₹4,695 crore
- 2022-23: ₹7,686 crore
- 2023-24: ₹8,139 crore
- Insight: The GVO for Moong shows high variability, with a sharp decline to ₹4,695 crore in 2021-22, followed by recovery to ₹8,139 crore in 2023-24. This suggests that Moong production is sensitive to environmental and market factors.
Key Observations
- Fluctuations in Bajra Output:
- The GVO for Bajra fluctuates significantly, indicating instability in production or market demand. The decline from the peak of ₹12,173 crore in 2022-23 to ₹9,041 crore in 2023-24 suggests that the crop faced challenges in the most recent year, possibly due to adverse climatic conditions or price volatility.
- Groundnut’s Strong Growth:
- Groundnut has shown consistent and strong growth, with its GVO nearly doubling from ₹6,996 crore in 2019-20 to ₹12,762 crore in 2023-24. This upward trend points to growing demand for groundnut, likely driven by both domestic consumption and export potential.
- Moong’s Volatility:
- Moong production shows high volatility, with a sharp drop in GVO in 2021-22, followed by recovery in the following years. The reasons behind these fluctuations could include weather conditions, pest outbreaks, or market price changes that affect the profitability of Moong cultivation.
Key Insights
- Market and Environmental Sensitivity:
- The data indicates that the output value of Kharif crops is highly sensitive to market and environmental conditions. Crops like Moong and Bajra show significant year-to-year variability, which may pose challenges for farmers in terms of income stability.
- Groundnut’s Potential for Expansion:
- Given the consistent growth in groundnut output, this crop presents opportunities for further investment and expansion. The rising GVO suggests that groundnut cultivation is becoming increasingly profitable, making it an important cash crop for farmers.
- Need for Crop-Specific Support:
- The fluctuating GVO for Bajra and Moong indicates a need for targeted interventions, such as climate-resilient farming techniques, improved access to inputs, or market price stabilization measures, to ensure more stable output and income for farmers.
Key Term
- Gross Value of Output (GVO): The total value of agricultural output at current market prices. It represents the market value of all goods produced during a given time period.
Conclusion
The GVO data for Kharif crops—Bajra, Groundnut, and Moong—shows significant variability, with Groundnut performing consistently well while Bajra and Moong experience fluctuations. This highlights the importance of supporting farmers with crop-specific strategies to manage risks and enhance productivity. Groundnut, in particular, shows strong potential for further growth, while Bajra and Moong may require more focused support to stabilize production and output values.
Figure 2.5
Analytical Summary
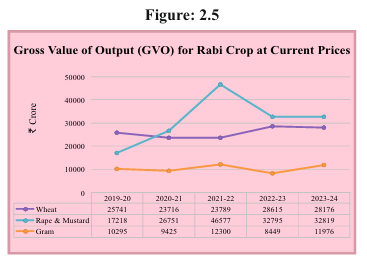
This graph presents the Gross Value of Output (GVO) for three major Rabi crops—Wheat, Rape & Mustard, and Gram—at current prices from 2019-20 to 2023-24.
Key Data Points (₹ Crore)
- Wheat:
- 2019-20: ₹25,741 crore
- 2020-21: ₹27,616 crore
- 2021-22: ₹25,879 crore
- 2022-23: ₹28,615 crore
- 2023-24: ₹28,176 crore
- Insight: The GVO for Wheat shows a stable trend, with a slight dip in 2021-22 but recovering to approximately ₹28,176 crore in 2023-24. This indicates consistent wheat production, with moderate variations likely due to climatic factors or market conditions.
- Rape & Mustard:
- 2019-20: ₹17,218 crore
- 2020-21: ₹26,751 crore
- 2021-22: ₹46,877 crore
- 2022-23: ₹32,795 crore
- 2023-24: ₹32,819 crore
- Insight: Rape & Mustard experienced a sharp increase in GVO, peaking at ₹46,877 crore in 2021-22. However, output value dropped in subsequent years, stabilizing around ₹32,819 crore in 2023-24. This volatility could reflect market price changes, weather impacts, or shifts in cultivation patterns.
- Gram:
- 2019-20: ₹10,295 crore
- 2020-21: ₹9,425 crore
- 2021-22: ₹12,300 crore
- 2022-23: ₹8,449 crore
- 2023-24: ₹11,976 crore
- Insight: Gram shows significant fluctuations in its GVO, peaking at ₹12,300 crore in 2021-22, followed by a sharp decline to ₹8,449 crore in 2022-23 and recovery to ₹11,976 crore in 2023-24. This volatility suggests that Gram production is highly sensitive to external factors such as climate, pest infestations, or market prices.
Key Observations
- Stable Wheat Production:
- Wheat demonstrates a relatively stable output value, with moderate fluctuations. The GVO has remained in the range of ₹25,000-28,000 crore, indicating consistent wheat cultivation and market demand.
- Volatility in Rape & Mustard:
- Rape & Mustard shows notable volatility, with a sharp increase in 2021-22 followed by a decline. The peak in 2021-22 may have been driven by favorable market prices or an expansion in cultivation, but the subsequent decline suggests a correction in production or market conditions.
- Fluctuating Gram Production:
- Gram shows significant variability in output, with sharp increases followed by steep declines. The recovery in 2023-24 suggests that Gram production is cyclical or highly sensitive to changing agricultural conditions.
Key Insights
- Wheat as a Stable Crop:
- Wheat appears to be the most stable of the three Rabi crops, with steady output and relatively minor fluctuations in GVO. This suggests that wheat production is less vulnerable to market or environmental disruptions compared to crops like Rape & Mustard or Gram.
- Challenges in Mustard and Gram Cultivation:
- The significant fluctuations in Rape & Mustard and Gram indicate potential challenges in managing these crops, possibly due to changing market dynamics, input costs, or weather conditions. The high volatility in GVO suggests that these crops may require targeted interventions to ensure stable production and farmer incomes.
- Market Sensitivity:
- The sharp rise and fall in Rape & Mustard production value highlight the importance of market prices in determining GVO. Policies aimed at stabilizing prices and providing market access to farmers could help reduce these fluctuations and ensure more predictable incomes.
Key Term
- Gross Value of Output (GVO): The total market value of agricultural output, reflecting both production volume and market prices.
Conclusion
The GVO for Wheat, Rape & Mustard, and Gram demonstrates varying trends, with Wheat remaining stable while Rape & Mustard and Gram exhibit significant volatility. The sharp fluctuations in these crops suggest a need for more resilient agricultural practices and market interventions to ensure consistent production and income for farmers.
Figure 2.6
Analytical Summary
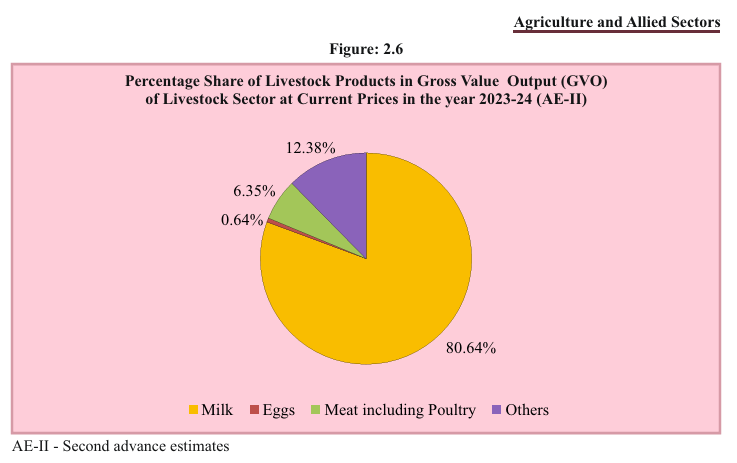
This pie chart represents the percentage share of various livestock products in the Gross Value Output (GVO) of the Livestock Sector at current prices for the year 2023-24 (Second Advance Estimates – AE-II). The livestock sector includes products such as Milk, Eggs, Meat including Poultry, and Others.
Key Data Points
- Milk:
- Share: 80.64%
- Insight: Milk dominates the livestock sector, contributing over 80% of the total GVO. This reflects the importance of dairy farming in Rajasthan, which is a major milk-producing state in India. The significant share of milk in the livestock sector emphasizes its central role in rural livelihoods and the state’s agricultural economy.
- Meat including Poultry:
- Share: 12.38%
- Insight: Meat including Poultry accounts for 12.38% of the livestock sector’s GVO. This indicates a substantial but smaller contribution compared to milk, showing that meat production is an important but secondary activity in the livestock sector.
- Eggs:
- Share: 6.35%
- Insight: Eggs make up 6.35% of the GVO, reflecting the growing poultry industry in Rajasthan. The egg sector, while smaller than milk and meat, provides an important source of protein and income, particularly in regions focusing on poultry farming.
- Others:
- Share: 0.64%
- Insight: The Others category, which includes by-products like wool or hides, contributes a small portion (0.64%) of the GVO. This indicates that these by-products, while valuable, are not as economically significant compared to the main livestock products.
Key Observations
- Dominance of Dairy Production:
- Milk accounts for the overwhelming majority of the livestock sector’s output, with over 80% of the total GVO. This highlights the critical role of dairy farming in Rajasthan’s rural economy, supported by the state’s strong tradition of livestock rearing and milk production.
- Meat and Poultry’s Role:
- Meat including Poultry contributes 12.38% to the livestock GVO, indicating that meat production is a significant secondary activity. This sector provides a substantial source of income for farmers engaged in animal husbandry beyond dairy farming.
- Growth in Poultry (Eggs):
- The Egg sector, with a 6.35% share, reflects the growing importance of poultry farming in Rajasthan. With increasing demand for eggs as a source of nutrition, this sector has the potential to expand further, contributing to both income diversification and food security.
- Limited Contribution of By-products:
- The Others category, comprising wool, hides, and other by-products, contributes only 0.64% of the GVO. This suggests that while these products are valuable, they do not play a major role in the overall livestock economy.
Key Insights
- Importance of Dairy Farming:
- The large share of milk in the livestock sector’s GVO underscores the need for continued investment in dairy farming infrastructure, such as milk processing facilities, cold storage, and market access. Enhancing the dairy supply chain could further boost productivity and income for dairy farmers.
- Opportunities in Meat and Poultry:
- Meat including Poultry and Eggs represent growing sectors with the potential for expansion. Investments in animal health, better rearing practices, and market access for poultry and meat products could lead to increased contributions from these sectors in the future.
- Value Addition for By-products:
- The small share of by-products in the livestock sector’s GVO suggests opportunities for value addition. Expanding industries around wool, hides, and other livestock by-products could diversify income sources for farmers and increase the overall value generated by the livestock sector.
Key Term
- Gross Value of Output (GVO): The total market value of output produced in a sector at current prices, representing the economic contribution of the sector.
Conclusion
The livestock sector in Rajasthan is dominated by milk production, which accounts for over 80% of the sector’s total value. Meat including Poultry and Eggs also play significant roles, contributing to income diversification and food security. With opportunities for growth in the poultry and meat sectors, and potential for value addition in by-products, the livestock sector holds substantial promise for further development and economic impact.
Figure 2.7

Analytical Summary
This pie chart represents the Land Use Statistics for Rajasthan for the year 2022-23, breaking down the distribution of land across various categories such as Forest, Agricultural Land, Barren & Uncultivable Land, and Grazing Lands, among others.
Key Data Points (Percentage of Total Land)
- Net Area Sown:
- Share: 53.74%
- Insight: The largest portion of Rajasthan’s land is used for Net Area Sown, accounting for over half of the total land at 53.74%. This indicates that agricultural activities dominate the land use in Rajasthan, reflecting the importance of farming to the state’s economy and livelihoods.
- Forest:
- Share: 8.09%
- Insight: Forest land makes up 8.09% of the total land area. While forests provide critical ecological services such as carbon sequestration and biodiversity, their relatively small share suggests limited forest cover in the state, which could be due to Rajasthan’s arid climate and geography.
- Permanent Pasture & Other Grazing Lands:
- Share: 4.82%
- Insight: Permanent Pasture & Grazing Lands represent 4.82% of the land use. Grazing land is crucial for supporting Rajasthan’s large livestock population, especially in rural areas dependent on animal husbandry.
- Culturable Waste Land:
- Share: 10.39%
- Insight: Culturable Waste Land, land that could be used for agriculture but remains uncultivated, accounts for 10.39% of the total land. This land represents potential for future agricultural expansion, assuming proper investments in irrigation, soil health, and other factors.
- Current Fallow:
- Share: 5.68%
- Insight: Current Fallow land, which is temporarily out of cultivation, makes up 5.68% of the total area. This suggests that a portion of the land is being rested or not cultivated due to various reasons such as soil fertility management, lack of water, or market conditions.
- Fallow Lands Other than Current Fallow:
- Share: 4.38%
- Insight: Fallow Lands Other than Current Fallow represent 4.38% of the total land use. These lands have been left uncultivated for longer periods, indicating areas that may face challenges such as poor soil quality, water scarcity, or socio-economic factors that prevent cultivation.
- Barren & Uncultivable Land:
- Share: 6.89%
- Insight: Barren & Uncultivable Land makes up 6.89% of the total, representing land that cannot be used for productive purposes due to poor soil conditions, extreme terrain, or other environmental constraints.
- Area Under Non-Agricultural Uses:
- Share: 5.92%
- Insight: Land used for non-agricultural purposes, such as urban development, infrastructure, and industrial use, represents 5.92% of the total land area. This reflects the growing demand for land in urbanization and industrialization.
- Land Under Miscellaneous Tree Crops and Groves:
- Share: 0.09%
- Insight: This category represents a minimal share of 0.09%, suggesting that tree crops and groves are not a significant part of Rajasthan’s land use, potentially due to the state’s arid conditions that limit such plantations.
Key Observations
- Agricultural Dominance:
- The largest share of land is dedicated to Net Area Sown, indicating that agriculture remains the most significant land use in Rajasthan. This highlights the dependence of the state’s economy on farming activities, despite the challenges posed by its arid environment.
- Potential for Land Reclamation:
- Culturable Waste Land and Fallow Lands together make up a significant portion of land. With Culturable Waste Land at 10.39% and Fallow Lands (both current and other) at around 10%, there is potential for increasing agricultural productivity through land reclamation, provided proper interventions are made in terms of water management and soil improvement.
- Limited Forest Cover:
- The relatively small share of Forest land (8.09%) reflects the state’s natural limitations for forest expansion. Given Rajasthan’s climatic conditions, expanding forest cover may be challenging, but conserving existing forests is critical for ecological balance and climate adaptation.
- Urbanization Pressure:
- The share of land under non-agricultural uses (5.92%) suggests that urbanization and industrial development are also significant in Rajasthan. As the state’s economy diversifies, this share may grow, potentially putting pressure on agricultural land and natural resources.
Key Insights
- Balancing Agriculture with Other Uses:
- With over 53% of the land dedicated to agriculture, Rajasthan’s land use pattern is heavily tilted toward farming. However, as the state continues to develop, there may be increasing competition for land from non-agricultural sectors. This makes it essential to balance agricultural productivity with sustainable urban development and industrial growth.
- Land Reclamation for Agriculture:
- The Culturable Waste Land and Fallow Lands categories indicate room for expanding agricultural activity, but this will require significant investments in irrigation infrastructure, soil management, and technology adoption. Efficient use of these lands could help address food security and rural income challenges.
- Grazing and Livestock Importance:
- Permanent Pasture & Grazing Lands account for nearly 5% of the total land, underscoring the importance of livestock in Rajasthan’s economy. Given the state’s large livestock population, maintaining and possibly expanding grazing lands is crucial for the sustainability of animal husbandry.
Key Term
- Net Area Sown: The total area on which crops are grown during a given agricultural year.
Conclusion
The Land Use Statistics for 2022-23 reveal the agricultural dominance of Rajasthan’s land use, with over half the land dedicated to Net Area Sown. However, there is potential for land reclamation, particularly in Culturable Waste Land and Fallow Lands. With growing urbanization and the need for sustainable land management, Rajasthan faces the challenge of balancing its agricultural needs with the demands of industrial and urban development.
Table 2.1
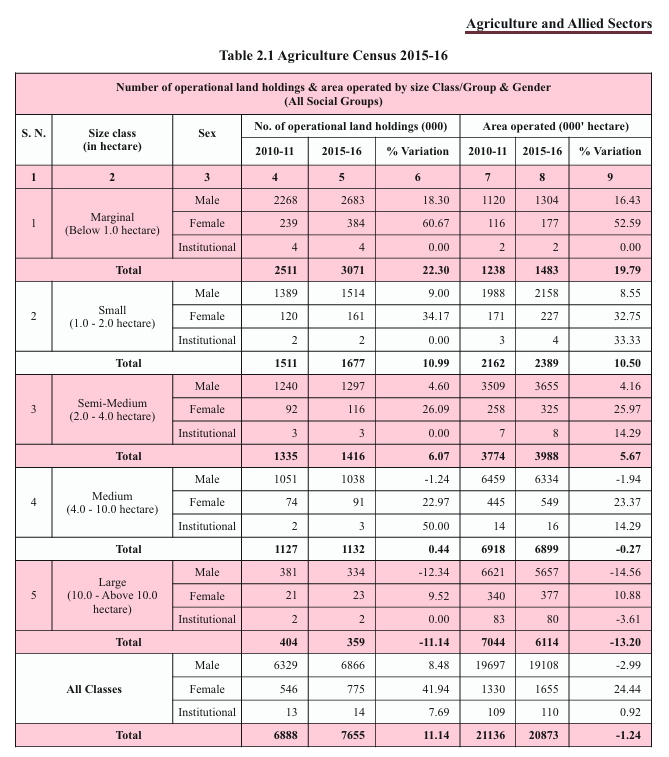
Analytical Summary
This table from the Agriculture Census 2015-16 shows the number of operational land holdings and area operated by different size classes of landholdings (in hectares), broken down by sex and institutional categories. It also compares data from 2010-11 to 2015-16 and presents the percentage variations over the period.
Key Data Points
- Marginal Landholdings (Below 1 hectare):
- Number of Operational Holdings (2015-16):
- Total: 3,071,000 (22.30% increase from 2010-11)
- Male: 2,683,000 (18.30% increase)
- Female: 384,000 (60.67% increase)
- Institutional: 4,000 (No change)
- Area Operated:
- Total: 1,483,000 hectares (19.79% increase)
- Male: 1,304,000 hectares (16.43% increase)
- Female: 177,000 hectares (52.59% increase)
- Institutional: 2,000 hectares (No change)
- Insight: The sharp increase in the number of marginal landholdings (especially among female holders) and the area operated shows that small-scale farming continues to dominate, with growing female participation in landholding.
- Number of Operational Holdings (2015-16):
- Small Landholdings (1.0 – 2.0 hectares):
- Number of Operational Holdings (2015-16):
- Total: 1,677,000 (10.99% increase)
- Male: 1,514,000 (9.00% increase)
- Female: 161,000 (34.17% increase)
- Institutional: 2,000 (No change)
- Area Operated:
- Total: 2,389,000 hectares (10.50% increase)
- Male: 2,158,000 hectares (8.55% increase)
- Female: 227,000 hectares (32.75% increase)
- Insight: Small landholdings show moderate growth in both number and area operated, with a significant rise in female ownership. The steady increase suggests that smallholders remain crucial to agriculture, and their role is expanding.
- Number of Operational Holdings (2015-16):
- Semi-Medium Landholdings (2.0 – 4.0 hectares):
- Number of Operational Holdings (2015-16):
- Total: 1,416,000 (6.07% increase)
- Male: 1,297,000 (4.60% increase)
- Female: 116,000 (26.09% increase)
- Institutional: 3,000 (No change)
- Area Operated:
- Total: 3,988,000 hectares (5.67% increase)
- Male: 3,655,000 hectares (4.16% increase)
- Female: 325,000 hectares (25.97% increase)
- Institutional: 7,000 hectares (14.29% increase)
- Number of Operational Holdings (2015-16):
- Insight: Semi-medium holdings have seen moderate growth, with female participation increasing significantly, though male-dominated holdings still prevail. Institutional holdings also saw a slight increase in area operated.
- Medium Landholdings (4.0 – 10.0 hectares):
- Number of Operational Holdings (2015-16):
- Total: 1,132,000 (0.44% increase)
- Male: 1,038,000 (-1.24% decline)
- Female: 91,000 (22.97% increase)
- Institutional: 3,000 (50.00% increase)
- Area Operated:
- Total: 6,899,000 hectares (-0.27% decline)
- Male: 6,334,000 hectares (-1.94% decline)
- Female: 549,000 hectares (23.37% increase)
- Institutional: 7,000 hectares (14.29% increase)
- Insight: Medium holdings have shown stagnation, with slight declines in both male ownership and area operated. Female and institutional holdings, however, have increased, indicating a shift in land distribution patterns in this size class.
- Number of Operational Holdings (2015-16):
- Large Landholdings (Above 10 hectares):
- Number of Operational Holdings (2015-16):
- Total: 359,000 (-11.14% decline)
- Male: 334,000 (-12.34% decline)
- Female: 23,000 (9.52% increase)
- Institutional: 2,000 (No change)
- Area Operated:
- Total: 6,114,000 hectares (-13.20% decline)
- Male: 5,657,000 hectares (-14.56% decline)
- Female: 370,000 hectares (10.88% increase)
- Institutional: 83,000 hectares (-3.61% decline)
- Insight: Large holdings have experienced significant declines in both number and area operated, especially among male and institutional holders. However, female participation in large holdings has risen, reflecting changing dynamics in land ownership.
- Number of Operational Holdings (2015-16):
- Overall (All Classes):
- Number of Operational Holdings (2015-16):
- Total: 7,655,000 (11.14% increase)
- Male: 6,866,000 (8.48% increase)
- Female: 775,000 (41.94% increase)
- Institutional: 14,000 (7.69% increase)
- Area Operated:
- Total: 20,873,000 hectares (-1.24% decline)
- Male: 19,697,000 hectares (-2.99% decline)
- Female: 1,650,000 hectares (24.44% increase)
- Institutional: 110,000 hectares (0.92% increase)
- Insight: The overall trend shows an increase in the number of operational holdings, particularly among females, but a slight decline in total area operated. This indicates a trend toward smaller average farm sizes as the number of landholders increases but the total land area does not keep pace.
- Number of Operational Holdings (2015-16):
Key Observations
- Increase in Female Landholders:
- Across all size categories, female participation in landholding has increased significantly, with a 41.94% rise overall. This reflects a positive shift toward gender inclusivity in land ownership, though women still hold a smaller portion of the land compared to men.
- Decline in Large and Medium Landholdings:
- There is a clear decline in the number and area of large and medium landholdings, indicating a trend toward fragmentation of landholdings. This could be due to population growth, inheritance laws, or land sales breaking down larger farms into smaller units.
- Expansion of Marginal and Small Holdings:
- The number of marginal and small landholdings has increased, showing a trend toward smaller farm sizes. This fragmentation can have implications for agricultural productivity, as smaller holdings may struggle with economies of scale.
- Institutional Landholdings:
- Institutional landholdings have remained relatively stable, with minor increases in some categories. Institutional holdings represent a very small portion of overall land use in Rajasthan, indicating that most land is held by individual farmers rather than corporate or state entities.
Key Insights
- Land Fragmentation:
- The increase in the number of operational holdings, combined with the decline in total area operated, suggests ongoing land fragmentation. This trend could affect agricultural productivity and calls for policies that encourage land consolidation or cooperative farming to maintain efficient agricultural practices.
- Gender Inclusivity:
- The substantial rise in female landholders across all categories reflects increasing gender inclusivity in land ownership. Empowering women through land ownership can improve rural livelihoods and enhance economic resilience in agricultural communities.
- Challenges for Large Landholdings:
- The sharp decline in large landholdings points to challenges faced by larger farms, potentially due to land reforms, economic pressures, or social factors. Supporting large-scale farms through modern technology and infrastructure could help improve agricultural productivity.
Key Term
- Operational Land Holding: A piece of land operated as a single unit by one person alone or with others, regardless of the size, location, or title of ownership.
Conclusion
The Agricultural Census 2015-16 reveals ongoing land fragmentation in Rajasthan, with a decline in medium and large landholdings and a rise in marginal and small landholdings. The growing number of female landholders is a positive trend, indicating greater gender equality in land ownership. The data highlights the need for policies that support land consolidation, productivity improvements, and inclusivity in the agricultural sector.
Table 2.2
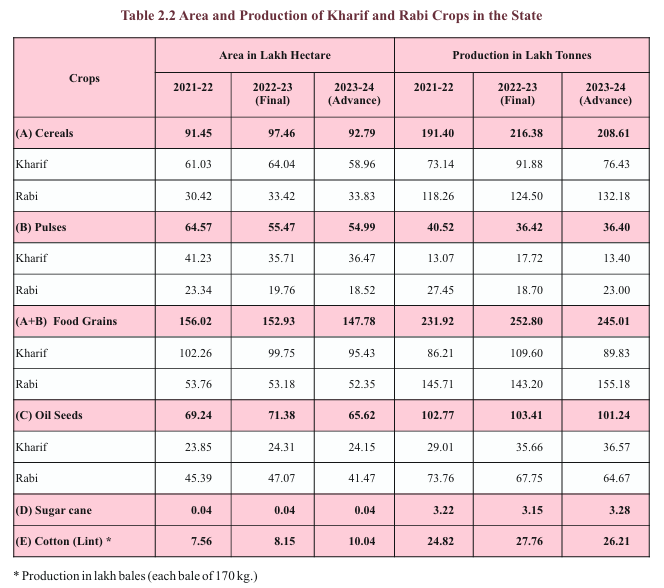
Analytical Summary
This table outlines the area (in lakh hectares) and production (in lakh tonnes) of Kharif and Rabi crops for various categories of crops, including Cereals, Pulses, Food Grains, Oil Seeds, Sugarcane, and Cotton over three years: 2021-22, 2022-23 (Final), and 2023-24 (Advance Estimates).
Key Data Points
- Cereals:
- Area (2023-24): 92.79 lakh hectares
- Production (2023-24): 208.61 lakh tonnes
- Kharif: 58.96 lakh hectares, 76.43 lakh tonnes
- Rabi: 33.83 lakh hectares, 132.18 lakh tonnes
- Insight: The area under cereals has decreased slightly from 97.46 lakh hectares in 2022-23 to 92.79 lakh hectares in 2023-24, accompanied by a slight dip in production from 216.38 lakh tonnes to 208.61 lakh tonnes. Rabi cereals continue to dominate in production, reflecting the state’s emphasis on Rabi cropping.
- Pulses:
- Area (2023-24): 54.99 lakh hectares
- Production (2023-24): 36.40 lakh tonnes
- Kharif: 36.47 lakh hectares, 13.40 lakh tonnes
- Rabi: 18.52 lakh hectares, 23.00 lakh tonnes
- Insight: The area and production of pulses have remained relatively stable from 2022-23 to 2023-24, with Rabi pulses contributing a significant share to total production (63%).
- Food Grains (Cereals + Pulses):
- Area (2023-24): 147.78 lakh hectares
- Production (2023-24): 245.01 lakh tonnes
- Kharif: 95.43 lakh hectares, 89.83 lakh tonnes
- Rabi: 52.35 lakh hectares, 155.18 lakh tonnes
- Insight: The total area under food grains has decreased marginally, with a reduction in Kharif cultivation. However, Rabi food grains continue to dominate production, indicating a strong Rabi cropping system in Rajasthan.
- Oil Seeds:
- Area (2023-24): 65.62 lakh hectares
- Production (2023-24): 101.24 lakh tonnes
- Kharif: 24.15 lakh hectares, 36.57 lakh tonnes
- Rabi: 41.47 lakh hectares, 64.67 lakh tonnes
- Insight: Oil seeds, especially during the Rabi season, play a crucial role in Rajasthan’s agricultural economy. The area under oil seeds has decreased from 71.38 lakh hectares in 2022-23 to 65.62 lakh hectares in 2023-24, resulting in a slight dip in production.
- Sugarcane:
- Area (2023-24): 0.04 lakh hectares
- Production (2023-24): 3.28 lakh tonnes
- Insight: Sugarcane cultivation remains limited in Rajasthan, with no significant change in area or production over the years.
- Cotton (Lint):
- Area (2023-24): 10.04 lakh hectares
- Production (2023-24): 26.21 lakh bales
- Insight: Cotton cultivation has increased significantly from 8.15 lakh hectares in 2022-23 to 10.04 lakh hectares in 2023-24, indicating growing interest in cotton as a cash crop. Production has also risen, reflecting favorable conditions for cotton cultivation.
Key Observations
- Dominance of Rabi Cropping:
- The production of Rabi crops surpasses that of Kharif crops, particularly in cereals, pulses, and oil seeds. The Rabi season plays a crucial role in Rajasthan’s agricultural output, contributing the majority of food grain and oil seed production.
- Stability in Pulses:
- The area and production of pulses have remained relatively stable, with Rabi pulses dominating production. This stability suggests that pulses are an integral part of Rajasthan’s cropping system, providing a reliable source of income and nutrition.
- Shift in Oil Seeds:
- While the area under oil seeds has slightly decreased in 2023-24, production remains relatively high. The state’s focus on oil seed crops during the Rabi season highlights their importance in the agricultural economy, particularly for mustard cultivation.
- Increase in Cotton Cultivation:
- The increase in area and production of cotton indicates a growing interest in this cash crop. Cotton’s expansion suggests that farmers are diversifying their crops to include more market-oriented agricultural products.
Key Insights
- Focus on Rabi Season:
- Rajasthan’s agricultural economy is highly dependent on the Rabi season, with cereals, pulses, and oil seeds showing higher production during this period. Policies and investments in irrigation, storage, and processing facilities during the Rabi season can further boost productivity and farmer incomes.
- Pulses as a Stable Crop:
- The stability in pulses area and production reflects their resilience and importance in crop rotation and soil fertility management. Continued support for pulse cultivation through improved seed varieties and market access can ensure sustainable production.
- Cotton’s Growing Role:
- The increase in cotton area and production suggests opportunities for expanding cotton cultivation, particularly in regions suited to this crop. Investments in cotton processing and value addition could provide farmers with higher incomes.
- Oil Seed Importance:
- Oil seeds, especially mustard, remain a key crop in Rajasthan, particularly in the Rabi season. Supporting mustard farmers with better market access and processing infrastructure could enhance the profitability of this vital crop.
Key Term
- Lakh Bales: A unit of measurement for cotton, where each bale weighs approximately 170 kg.
Conclusion
The table shows a strong emphasis on Rabi cropping in Rajasthan, particularly for cereals, pulses, and oil seeds. While the area under cultivation has slightly decreased in recent years, production remains stable, reflecting the resilience of the state’s agricultural sector. The increase in cotton cultivation and the steady performance of pulses and oil seeds underscore Rajasthan’s diverse agricultural landscape.
Figure 2.8
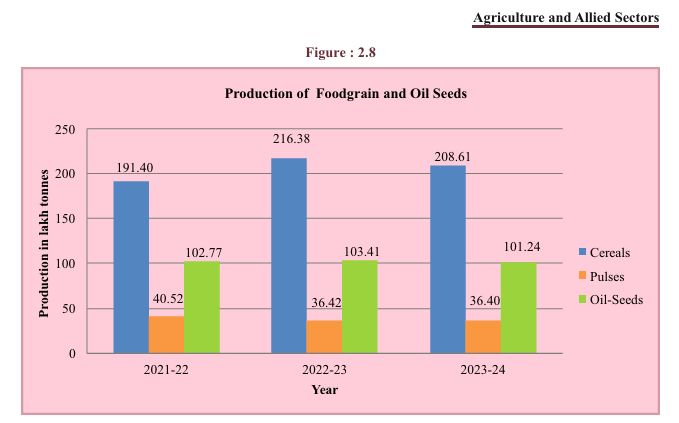
Analytical Summary
This bar chart presents the production of Cereals, Pulses, and Oil Seeds in Rajasthan over three years: 2021-22, 2022-23, and 2023-24. Production is measured in lakh tonnes for cereals and pulses and in lakh bales for oil seeds.
Key Data Points (Production in Lakh Tonnes)
- Cereals:
- 2021-22: 191.40 lakh tonnes
- 2022-23: 216.38 lakh tonnes
- 2023-24: 208.61 lakh tonnes
- Insight: The production of cereals shows an increasing trend from 2021-22 to 2022-23, but there is a slight dip in 2023-24. Despite this decline, cereal production remains strong, making it the highest-producing category among food grains and oil seeds.
- Pulses:
- 2021-22: 40.52 lakh tonnes
- 2022-23: 36.42 lakh tonnes
- 2023-24: 36.40 lakh tonnes
- Insight: Pulses production decreased in 2022-23 compared to 2021-22 and remained relatively stable in 2023-24. This reflects minor fluctuations in pulse production over the years, but the overall trend remains steady.
- Oil Seeds:
- 2021-22: 102.77 lakh tonnes
- 2022-23: 103.41 lakh tonnes
- 2023-24: 101.24 lakh tonnes
- Insight: The production of oil seeds remains fairly consistent over the three-year period, with a slight decline in 2023-24. Oil seeds, like cereals, are a significant part of the agricultural economy in Rajasthan, but they do not show as much variability as other crops.
Key Observations
- Dominance of Cereal Production:
- Cereals account for the highest production among the three categories, with production levels consistently above 190 lakh tonnes. This reflects Rajasthan’s heavy reliance on cereal crops like wheat, bajra, and maize as staple food grains.
- Stable Oil Seed Production:
- Oil seeds production remains stable, with only slight fluctuations over the three years. Oil seed crops, such as mustard, play a key role in Rajasthan’s agricultural output, and their production levels are second only to cereals.
- Minor Fluctuations in Pulses:
- Pulses production has shown a slight decline since 2021-22, but it remains stable over the 2022-23 and 2023-24 periods. Pulses continue to be an important crop for food security and income generation, though they do not reach the production levels of cereals and oil seeds.
Key Insights
- Cereals as a Dominant Crop:
- The steady increase in cereal production, with only a slight decline in 2023-24, suggests that cereal crops are the backbone of Rajasthan’s agricultural production. Supporting cereal production through improved farming practices, irrigation, and market access could enhance overall food grain output.
- Stability in Oil Seed Production:
- The oil seed sector shows a high degree of stability, reflecting its resilience in the face of changing weather patterns and market conditions. Continued focus on oil seed crops, particularly mustard, can help strengthen Rajasthan’s role in oil seed production.
- Pulses Require Attention:
- While pulses production has remained relatively stable, the slight decline over the years indicates that there may be challenges in this sector. Investment in better pulse varieties, soil management, and market infrastructure could help stabilize and increase pulse production.
Conclusion
The chart highlights the dominance of cereals in Rajasthan’s agricultural production, with a steady upward trend, while oil seeds and pulses remain stable, though pulses show a slight downward trend. The consistency in oil seed production emphasizes their importance in the agricultural landscape, while cereals continue to be the primary driver of food grain production.
Table 2.3
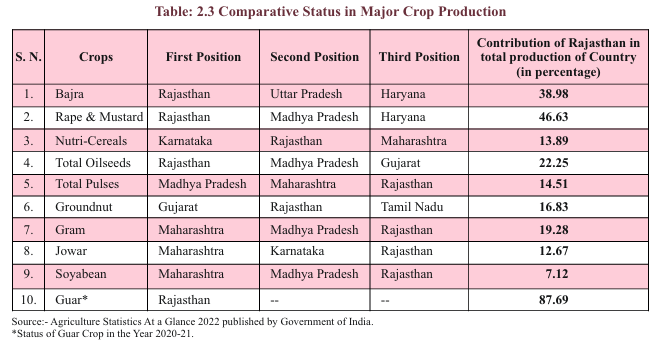
Analytical Summary
This table shows the comparative status of Rajasthan in the production of various major crops in India, ranking the top three states for each crop. It also presents the contribution of Rajasthan to the total production of each crop in the country, expressed as a percentage.
Key Data Points
- Bajra:
- First Position: Rajasthan
- Second Position: Uttar Pradesh
- Third Position: Haryana
- Contribution of Rajasthan: 38.98%
- Insight: Rajasthan leads in Bajra production, contributing nearly 39% to the national total, making it a dominant player in this crop.
- Rape & Mustard:
- First Position: Rajasthan
- Second Position: Madhya Pradesh
- Third Position: Haryana
- Contribution of Rajasthan: 46.63%
- Insight: Rajasthan is the largest producer of Rape & Mustard in India, contributing almost 47% of the total production. This reflects the state’s focus on oil seed crops, particularly mustard.
- Nutri-Cereals:
- First Position: Karnataka
- Second Position: Rajasthan
- Third Position: Maharashtra
- Contribution of Rajasthan: 13.89%
- Insight: Rajasthan holds the second position in Nutri-Cereal production, contributing nearly 14% of the country’s total output, showing its importance in producing nutritious cereals like millets.
- Total Oilseeds:
- First Position: Rajasthan
- Second Position: Madhya Pradesh
- Third Position: Gujarat
- Contribution of Rajasthan: 22.25%
- Insight: Rajasthan is the top producer of total oilseeds, contributing 22.25% to the national total. This highlights Rajasthan’s dominance in oil seed production, a critical crop category for the state’s economy.
- Total Pulses:
- First Position: Madhya Pradesh
- Second Position: Maharashtra
- Third Position: Rajasthan
- Contribution of Rajasthan: 14.51%
- Insight: Rajasthan ranks third in total pulses production, contributing 14.51% to the national total. Pulses are an important part of Rajasthan’s agricultural economy, though it lags behind Madhya Pradesh and Maharashtra in this sector.
- Groundnut:
- First Position: Gujarat
- Second Position: Rajasthan
- Third Position: Tamil Nadu
- Contribution of Rajasthan: 16.83%
- Insight: Rajasthan is the second-largest producer of groundnut in India, contributing 16.83% to the national total, highlighting the importance of this oil seed crop.
- Gram:
- First Position: Maharashtra
- Second Position: Madhya Pradesh
- Third Position: Rajasthan
- Contribution of Rajasthan: 19.28%
- Insight: Rajasthan ranks third in gram production, contributing 19.28% to the country’s output, emphasizing its role in pulse production.
- Jowar:
- First Position: Maharashtra
- Second Position: Karnataka
- Third Position: Rajasthan
- Contribution of Rajasthan: 12.67%
- Insight: Rajasthan holds the third position in jowar production, contributing 12.67% to the national total. This reflects the crop’s significance in Rajasthan’s cereal production.
- Soyabean:
- First Position: Maharashtra
- Second Position: Madhya Pradesh
- Third Position: Rajasthan
- Contribution of Rajasthan: 7.12%
- Insight: Rajasthan ranks third in soybean production, contributing 7.12% of the country’s total, which is a smaller share compared to its contribution to other crops like mustard and oilseeds.
- Guar:
- First Position: Rajasthan
- Contribution of Rajasthan: 87.69%
- Insight: Rajasthan is the dominant producer of Guar, contributing 87.69% to India’s total guar production. This overwhelming share highlights Rajasthan’s near monopoly on this crop, which is used for industrial and food purposes.
Key Observations
- Rajasthan’s Dominance in Certain Crops:
- Rajasthan leads in the production of Bajra, Rape & Mustard, Total Oilseeds, and Guar, with substantial contributions ranging from 38.98% to 87.69% of the national total. These crops are critical to the state’s agricultural economy and highlight its agricultural strengths.
- Strong Performance in Oilseeds:
- With a contribution of 22.25% in total oilseeds, Rajasthan stands as a leader in oil seed production, driven by its focus on mustard cultivation.
- Significant Contribution to Pulses and Groundnut:
- Rajasthan plays a crucial role in pulses and groundnut production, ranking third in total pulses (14.51%) and second in groundnut (16.83%). This highlights the state’s contribution to India’s food security and its role in pulse cultivation.
- Leadership in Guar Production:
- Rajasthan’s overwhelming contribution of 87.69% in Guar production underscores its dominance in this niche crop, which has both industrial and agricultural importance, particularly in the export market.
Key Insights
- Strategic Role in National Agriculture:
- Rajasthan is a key player in India’s agriculture, particularly for Bajra, Mustard, and Guar, where it leads by a significant margin. Supporting these crops through infrastructure, market access, and research can further solidify Rajasthan’s position as a national leader in these sectors.
- Diversified Crop Production:
- The state produces a wide variety of crops, including cereals, pulses, and oil seeds, which helps diversify its agricultural economy. This diversification ensures that Rajasthan remains resilient to market and climate-related shocks.
- Opportunities for Growth:
- While Rajasthan excels in several crops, there is room for growth in areas like soybean, jowar, and nutri-cereals, where it holds the third or second position. Improved technology, irrigation, and market support could help boost production in these crops.
Conclusion
Rajasthan plays a leading role in India’s agricultural sector, particularly in the production of Bajra, Rape & Mustard, Oilseeds, and Guar. The state’s agricultural landscape is diverse, with significant contributions to both staple crops and industrial crops. The data highlights the state’s potential for continued growth, especially with strategic support for crops where it holds a competitive edge.
Table 2.4
Analytical Summary
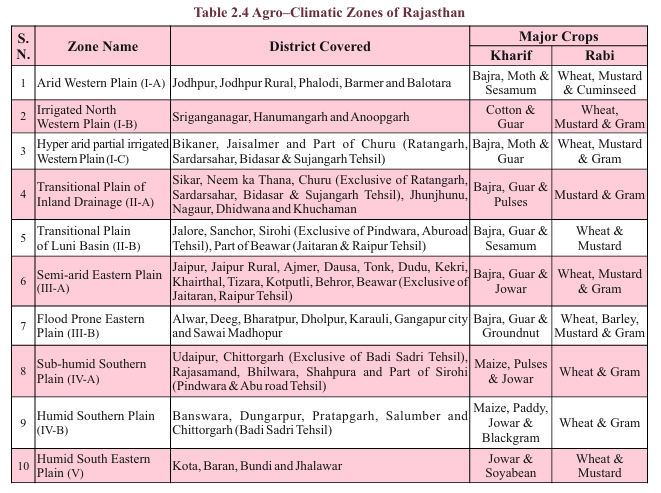
This table lists the agro-climatic zones of Rajasthan, the districts covered under each zone, and the major crops grown in both the Kharif and Rabi seasons. Rajasthan’s diverse climatic conditions support a variety of crops, with specific regions specializing in different agricultural outputs.
Key Data Points
- Arid Western Plain (1-A):
- Districts: Jodhpur, Jodhpur Rural, Phalodi, Barmer, Balotara
- Kharif Crops: Bajra, Moth, Sesamum
- Rabi Crops: Wheat, Mustard, Cuminseed
- Insight: The Arid Western Plain is characterized by dry conditions, where Bajra is a key Kharif crop and Mustard and Wheat dominate during the Rabi season.
- Irrigated North Western Plain (1-B):
- Districts: Sri Ganganagar, Hanumangarh, Anoopgarh
- Kharif Crops: Cotton, Guar
- Rabi Crops: Wheat, Mustard, Gram
- Insight: The Irrigated North Western Plain benefits from irrigation, allowing for the cultivation of Cotton and Guar in Kharif and a focus on Wheat and Mustard in Rabi.
- Hyper Arid Partial Irrigated Western Plain (1-C):
- Districts: Bikaner, Jaisalmer, Part of Churu (Ratangarh, Sardarshar, Bidasar, Sujangarh Tehsils)
- Kharif Crops: Bajra, Moth
- Rabi Crops: Wheat, Mustard, Gram
- Insight: This Hyper Arid Zone supports limited cultivation, with Bajra and Moth in Kharif and Wheat and Mustard during Rabi, relying on partial irrigation.
- Transitional Plain of Inland Drainage (II-A):
- Districts: Sikar, Neem Ka Thana, Churu (excluding certain Tehsils), Jhunjhunu, Nagaur, Didwana, Khuchaman
- Kharif Crops: Bajra, Guar, Pulses
- Rabi Crops: Wheat, Mustard
- Insight: The Transitional Plain is a key region for Bajra and Guar during Kharif and Wheat and Mustard during Rabi.
- Transitional Plain of Luni Basin (II-B):
- Districts: Jalore, Sanchore, Sirohi (excluding Pindwara, Abu Road), Parts of Barmer
- Kharif Crops: Bajra, Guar, Pulses
- Rabi Crops: Wheat, Mustard
- Insight: This zone specializes in Guar and Pulses during Kharif and follows a similar pattern to other regions in growing Wheat and Mustard in Rabi.
- Semi-Arid Eastern Plain (III-A):
- Districts: Jaipur, Ajmer, Dausa, Tonk, Beawar, Part of Nagaur
- Kharif Crops: Bajra, Guar
- Rabi Crops: Wheat, Mustard, Gram
- Insight: The Semi-Arid Eastern Plain is characterized by mixed cropping systems, with a focus on Bajra and Guar in Kharif and diverse Rabi crops like Wheat, Mustard, and Gram.
- Flood-Prone Eastern Plain (III-B):
- Districts: Alwar, Deeg, Bharatpur, Dholpur, Gangapur City
- Kharif Crops: Bajra, Guar, Groundnut
- Rabi Crops: Wheat, Barley, Mustard
- Insight: This flood-prone region has diverse cropping patterns, with Groundnut and Guar in Kharif and Wheat and Barley in Rabi.
- Sub-Humid Southern Plain (IV-A):
- Districts: Udaipur, Chittorgarh (excluding Badi Sadri Tehsil), Rajsamand, Bhilwara, Shapura
- Kharif Crops: Maize, Pulses, Jowar
- Rabi Crops: Wheat, Gram
- Insight: The Sub-Humid Southern Plain supports Maize and Pulses during Kharif, along with Jowar, and focuses on Wheat and Gram in Rabi.
- Humid Southern Plain (IV-B):
- Districts: Banswara, Dungarpur, Pratapgarh, Salumber
- Kharif Crops: Maize, Paddy, Jowar, Blackgram
- Rabi Crops: Wheat, Gram
- Insight: The Humid Southern Plain features diverse Kharif cropping with Paddy and Maize, while Wheat and Gram dominate in Rabi.
- Humid South Eastern Plain (V):
- Districts: Kota, Baran, Bundi, Jhalawar
- Kharif Crops: Jowar, Soyabean
- Rabi Crops: Wheat, Mustard
- Insight: This zone is known for Soyabean cultivation during Kharif and follows a typical pattern of Wheat and Mustard during Rabi.
Key Observations
- Diverse Agro-Climatic Zones:
- Rajasthan’s agro-climatic zones range from arid to humid, each supporting different crops. Bajra, Guar, Wheat, and Mustard are widely grown across many zones, while crops like Maize, Pulses, and Soyabean are specific to certain regions.
- Role of Irrigation:
- Irrigated areas, such as the Irrigated North Western Plain, support cash crops like Cotton during Kharif, which is not possible in arid zones. Irrigation plays a vital role in diversifying crop patterns.
- Regional Specialization:
- Certain zones show specialization in particular crops. For example, the Humid South Eastern Plain focuses on Soyabean during Kharif, while the Flood-Prone Eastern Plain cultivates Groundnut.
- Rabi Dominance in Wheat and Mustard:
- Across all zones, Wheat and Mustard are dominant Rabi crops, reflecting their importance in Rajasthan’s agricultural economy.
Key Insights
- Adaptation to Climate:
- The cropping patterns across Rajasthan are well-adapted to the specific agro-climatic conditions, with drought-resistant crops like Bajra and Guar thriving in arid zones and moisture-loving crops like Paddy and Maize cultivated in humid regions.
- Opportunities for Diversification:
- There is potential to further diversify cropping patterns, especially in irrigated and humid zones. Expanding the cultivation of high-value crops like Soyabean and Cotton could enhance farmer incomes.
- Importance of Climate-Resilient Crops:
- Crops like Bajra, Guar, and Pulses are well-suited for Rajasthan’s arid and semi-arid zones, providing food security and income resilience in the face of climate variability.
Conclusion
Rajasthan’s diverse agro-climatic zones support a wide variety of crops, with Bajra, Wheat, Mustard, and Guar being the most widely grown. The region’s varied climate allows for specialized cropping systems that adapt to local conditions, providing a strong foundation for agricultural productivity. Strategic investments in irrigation and climate-resilient crops can further enhance agricultural sustainability in the state.
Table 2.5
Analytical Summary
This table provides a detailed overview of the physical progress of key agricultural components in Rajasthan for the year 2023-24, comparing the target versus the achievement for various agricultural initiatives and infrastructure projects.
Key Data Points:
- Pipeline:
- Target: 12,971 km
- Achievement: 8,075 km
- Percentage Achieved: 62.24%
- Insight: The development of agricultural pipelines has achieved about 62% of the target, indicating steady progress but still leaving room for expansion to meet water distribution needs.
- Diggi (Water Storage Ponds):
- Target: 5,000 units
- Achievement: 3,093 units
- Percentage Achieved: 61.86%
- Insight: The construction of Diggi units has reached approximately 62% of the goal. These water storage structures are crucial for rainwater harvesting and irrigation in water-scarce regions.
- Farm Ponds:
- Target: 25,000 units
- Achievement: 12,357 units
- Percentage Achieved: 49.43%
- Insight: Progress in building farm ponds has reached 49%, reflecting challenges in achieving the full target. Farm ponds are important for irrigation and water conservation, especially in drought-prone areas.
- Agriculture Implements:
- Target: 7,700 units
- Achievement: 6,416 units
- Percentage Achieved: 83.31%
- Insight: The distribution of agricultural implements has achieved over 83% of the target, showing strong progress in equipping farmers with tools necessary to enhance productivity.
- Plant Protection Equipment:
- Target: 2,495 units
- Achievement: 4,199 units
- Percentage Achieved: 168.28%
- Insight: The distribution of plant protection equipment has exceeded the target by 168%, indicating a significant focus on ensuring farmers have access to tools for pest and disease management.
- Farmer’s Visit:
- Target: 168 visits
- Achievement: 156 visits
- Percentage Achieved: 92.86%
- Insight: Farmer’s visits to agricultural programs or demonstration centers are close to the target, showing good engagement with agricultural development programs.
- Crop Demonstration:
- Target: 252,903 demonstrations
- Achievement: 176,354 demonstrations
- Percentage Achieved: 69.74%
- Insight: Crop demonstration programs, aimed at showcasing best farming practices, have achieved almost 70% of the target, reflecting good progress but room for further outreach.
- Seed Minikits Distribution:
- Target: 3,832,456 kits
- Achievement: 3,057,419 kits
- Percentage Achieved: 79.77%
- Insight: Distribution of seed minikits has reached nearly 80% of the target, ensuring that farmers have access to quality seeds for better crop yields.
- Integrated Pest Management Demonstration:
- Target: 200 demonstrations
- Achievement: 183 demonstrations
- Percentage Achieved: 91.50%
- Insight: Integrated Pest Management (IPM) demonstrations have achieved over 91% of the target, showcasing effective pest control methods to farmers.
- Farmer’s Training (1 and 2 Days):
- Target: 12,120 farmers
- Achievement: 11,559 farmers
- Percentage Achieved: 95.37%
- Insight: Farmer training programs have achieved 95% of their target, reflecting strong efforts in providing farmers with essential knowledge and skills.
- Farmer Awareness Training:
- Target: 2,200 sessions
- Achievement: 2,200 sessions
- Percentage Achieved: 100%
- Insight: Farmer awareness training has fully achieved its target, indicating successful completion of knowledge-sharing sessions aimed at educating farmers on modern farming techniques.
- Dhaincha Seed Minikit Distribution:
- Target: 300,000 kits
- Achievement: 155,122 kits
- Percentage Achieved: 51.71%
- Insight: Dhaincha seed distribution, which is used as a green manure for soil fertility, has reached about 52% of its target. More effort is needed to meet the full target.
- PP Chemical/Bio Pesticides:
- Target: 226,165 hectares
- Achievement: 100,136 hectares
- Percentage Achieved: 44.27%
- Insight: The coverage of PP chemicals/bio-pesticides has reached only 44% of the target, indicating a shortfall in pest control measures for the targeted hectares.
- Soil Health Card Distribution:
- Target: 720,000 cards
- Achievement: 721,000 cards
- Percentage Achieved: 100.14%
- Insight: The distribution of soil health cards, which provide essential information on soil quality, has slightly exceeded the target, reaching more farmers than planned.
- Barbed Wire Fencing:
- Target: 40,000,000 meters
- Achievement: 17,462,946 meters
- Percentage Achieved: 43.66%
- Insight: The installation of barbed wire fencing has achieved only 43% of the target. This fencing is critical for protecting crops from animals and securing farmland.
Key Observations
- High Achievement in Plant Protection Equipment:
- The target for plant protection equipment has been surpassed significantly, indicating strong efforts in ensuring farmers are equipped to combat pests and diseases.
- Progress in Agricultural Implements:
- The distribution of agriculture implements is close to the target, reflecting efforts to mechanize farming and enhance productivity across the state.
- Challenges in Meeting Farm Pond and Diggi Targets:
- The progress in farm ponds and diggi construction has been slower, achieving about 50-60% of the targets. These water conservation structures are critical for regions with scarce water resources.
- Full Success in Farmer Training Programs:
- Both farmer awareness training and farmer’s training programs have seen near-complete or full success, indicating strong outreach and capacity building among farmers.
- Shortfall in Barbed Wire Fencing:
- The barbed wire fencing target has been achieved at only 43%, suggesting logistical or resource challenges in protecting farmland from encroachment or wildlife.
Key Insights
- Focus on Pest Management and Soil Health:
- There has been significant progress in areas like plant protection equipment and soil health card distribution, which are critical for sustainable agriculture and long-term productivity.
- Need for Improved Water Management Infrastructure:
- Achievements in farm ponds, diggi, and pipeline installation are below target, pointing to the need for enhanced efforts in water management infrastructure to support agriculture in water-scarce regions.
- Importance of Farmer Education:
- The high success rates in farmer training and awareness programs show the importance of continuous farmer education for adopting modern practices and improving crop yields.
- Seed Distribution as a Critical Input:
- Seed minikit distribution has achieved nearly 80% of the target, demonstrating the state’s effort in ensuring farmers have access to high-quality seeds, a key input for agricultural success.
Conclusion
The physical progress of key agricultural components in Rajasthan for 2023-24 reflects substantial achievements in areas like plant protection, training, and seed distribution, while also indicating challenges in water management infrastructure and barbed wire fencing. Continued efforts are needed to meet the remaining targets, especially in critical areas such as water conservation and pest management.
Table 2.6

Analytical Summary
This table presents the productivity (measured in kilograms per hectare) of various agricultural crops in Rajasthan over different years, with data spanning from an average between 2007-08 to 2011-12 up to 2022-23 Final estimates.
Key Data Points
- Cereals:
- 2007-08 to 2011-12 Average: 1,617 kg/ha
- 2021-22: 2,093 kg/ha
- 2022-23 (Final): 2,220 kg/ha
- Insight: Productivity of cereals has seen a gradual increase over the years, reaching 2,220 kg/ha in 2022-23 from 1,617 kg/ha in 2007-08 to 2011-12. This reflects improvements in farming techniques, better seed varieties, and efficient water management.
- Pulses:
- 2007-08 to 2011-12 Average: 481 kg/ha
- 2021-22: 628 kg/ha
- 2022-23 (Final): 657 kg/ha
- Insight: The productivity of pulses has increased over time, though it remains relatively lower compared to cereals. From 481 kg/ha in the early period, productivity rose to 657 kg/ha in 2022-23, indicating slow but steady progress in this crop category.
- Food Grains (Cereals + Pulses):
- 2007-08 to 2011-12 Average: 1,291 kg/ha
- 2021-22: 1,486 kg/ha
- 2022-23 (Final): 1,653 kg/ha
- Insight: The overall productivity of food grains has improved, reaching 1,653 kg/ha in 2022-23, up from 1,291 kg/ha in the base period. This increase highlights the success of productivity-enhancing measures, particularly for cereals.
- Oilseeds:
- 2007-08 to 2011-12 Average: 1,144 kg/ha
- 2021-22: 1,449 kg/ha
- 2022-23 (Final): 1,499 kg/ha
- Insight: The productivity of oilseeds has shown steady growth, rising from 1,144 kg/ha to 1,499 kg/ha in 2022-23. Oilseeds, especially mustard, are a critical crop for Rajasthan, and their increasing productivity reflects enhanced farming practices.
- Sugarcane:
- 2007-08 to 2011-12 Average: 61,432 kg/ha
- 2021-22: 75,852 kg/ha
- 2022-23 (Final): 89,307 kg/ha
- Insight: Sugarcane productivity has experienced a significant rise, reaching 89,307 kg/ha in 2022-23 from 61,432 kg/ha in the early period. This reflects major improvements in sugarcane farming techniques, irrigation, and possibly the adoption of high-yield varieties.
- Cotton (Lint):
- 2007-08 to 2011-12 Average: 428 kg/ha
- 2021-22: 558 kg/ha
- 2022-23 (Final): 579 kg/ha
- Insight: The productivity of cotton (lint) has increased modestly over the years, from 428 kg/ha in the earlier period to 579 kg/ha in 2022-23. Although cotton is a key cash crop, its productivity growth has been relatively slower compared to other crops like cereals and oilseeds.
- Guar Seed:
- 2007-08 to 2011-12 Average: 409 kg/ha
- 2021-22: 419 kg/ha
- 2022-23 (Final): 540 kg/ha
- Insight: Guar seed productivity has shown improvement, particularly between 2021-22 and 2022-23, increasing from 409 kg/ha in the earlier period to 540 kg/ha in 2022-23. Guar is an important crop for industrial uses, and this rise in productivity indicates better farming practices or increased demand leading to efficiency.
Key Observations
- Significant Gains in Cereals and Oilseeds:
- Cereals and oilseeds have seen the most significant increases in productivity. This reflects concerted efforts to improve crop yields through better seed varieties, fertilizer use, and water management, especially for staples like wheat and mustard.
- Moderate Growth in Pulses:
- The productivity of pulses remains relatively lower compared to other crops, though it has improved steadily. With pulses being a key source of protein, further investment in pulse productivity could help ensure food security and nutrition.
- Dramatic Improvement in Sugarcane:
- The leap in sugarcane productivity, from 61,432 kg/ha to 89,307 kg/ha, reflects strong performance, potentially due to better irrigation, improved cane varieties, and government support in the sugarcane sector.
- Stable but Slow Growth in Cotton:
- Although cotton (lint) productivity has increased over time, the growth rate has been more modest compared to cereals and oilseeds. This suggests that further research and development are needed to improve cotton yields, especially given its importance as a cash crop.
- Recent Growth in Guar Seed:
- The jump in guar seed productivity from 419 kg/ha in 2021-22 to 540 kg/ha in 2022-23 reflects a positive trend in this niche crop, which has significant industrial uses in oil extraction and other sectors.
Key Insights
- Need for Continued Investment in Pulses:
- While the productivity of pulses is increasing, it remains significantly lower than cereals and oilseeds. This highlights the need for targeted efforts to boost pulse yields through better farming techniques, soil fertility management, and water use efficiency.
- Oilseeds as a Strategic Crop:
- The productivity growth in oilseeds, especially mustard, shows the importance of this crop to Rajasthan’s agricultural economy. Continued research into high-yield varieties and disease-resistant crops can further enhance the state’s leadership in oilseed production.
- Emerging Role of Guar Seed:
- The sharp increase in guar seed productivity in 2022-23 suggests rising demand and improvements in farming practices. Given its industrial applications, promoting guar cultivation could lead to higher farmer incomes, especially in arid regions where this crop thrives.
Conclusion
Overall, the productivity of agricultural crops in Rajasthan has shown a positive trajectory, particularly for cereals, oilseeds, and sugarcane. The data reflects the impact of improved agricultural practices, technological interventions, and government support programs. However, there is still room for growth in crops like pulses and cotton, which have seen slower gains in productivity.
Table 2.7
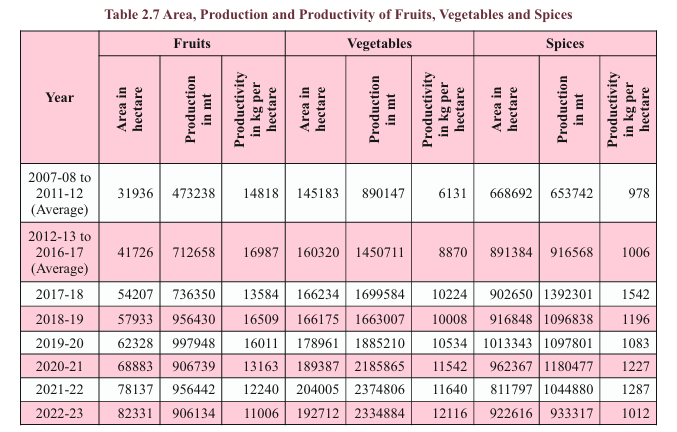
Analytical Summary
This table presents the area (in hectares), production (in metric tonnes), and productivity (in kg per hectare) of fruits, vegetables, and spices in Rajasthan over different years, comparing data from 2007-08 to 2022-23.
Key Data Points
- Fruits:
- Area (2022-23): 82,331 hectares
- Production (2022-23): 906,134 metric tonnes (mt)
- Productivity (2022-23): 11,006 kg/ha
- Insight: The area under fruit cultivation has steadily increased from an average of 31,936 hectares in 2007-08 to 2011-12 to 82,331 hectares in 2022-23. However, productivity has decreased from 14,818 kg/ha in the earlier period to 11,006 kg/ha in 2022-23. This drop in productivity suggests challenges in maintaining high yields despite expanding cultivation.
- Vegetables:
- Area (2022-23): 192,712 hectares
- Production (2022-23): 2,334,884 mt
- Productivity (2022-23): 12,116 kg/ha
- Insight: The area under vegetable cultivation has shown significant growth, with production increasing from 890,147 mt in the earlier period to over 2.33 million mt in 2022-23. However, productivity peaked in 2020-21 at 11,564 kg/ha and has remained relatively steady. The growth in area indicates rising demand for vegetables, but maintaining and improving productivity will be essential to meet future needs.
- Spices:
- Area (2022-23): 922,616 hectares
- Production (2022-23): 9,333,117 mt
- Productivity (2022-23): 1,012 kg/ha
- Insight: Spice cultivation has also expanded, particularly from 668,692 hectares in 2007-08 to 922,616 hectares in 2022-23. Productivity, which peaked at 1,287 kg/ha in 2021-22, decreased slightly to 1,012 kg/ha in 2022-23. This drop in productivity suggests the need for more efficient farming techniques or better seed varieties to sustain production levels.
Key Observations
- Expansion of Cultivated Area:
- There has been a marked increase in the area under cultivation for fruits, vegetables, and spices over the years, reflecting growing market demand and efforts to diversify Rajasthan’s agricultural output.
- Fluctuating Productivity:
- Despite the expansion in cultivation areas, the productivity of fruits and spices has seen some fluctuations. While the productivity of fruits has consistently decreased since 2007-08, vegetables and spices have shown varying trends, with spikes in certain years (e.g., 2020-21 for vegetables and spices).
- Steady Growth in Vegetable Production:
- Vegetables have shown consistent growth in both area and production, indicating strong demand and the sector’s ability to meet it. However, productivity has not increased at the same pace as the area, highlighting the need for better agricultural practices or technologies to improve yields.
- Spices as a Key Crop:
- Spices remain a key agricultural commodity in Rajasthan, with nearly 9.33 million tonnes produced in 2022-23. The decline in productivity from 2021-22 indicates that there might be challenges in sustaining high yields.
Key Insights
- Need for Improved Fruit Productivity:
- While the area under fruit cultivation has increased substantially, productivity has been on a downward trend. This suggests a need for improved fruit varieties, better orchard management, or more efficient irrigation and fertilization techniques to reverse this decline.
- Potential in Vegetable Cultivation:
- With the steady increase in both the area and production of vegetables, there is strong potential for Rajasthan to further enhance its role as a major vegetable-producing state. However, to maximize this potential, a focus on improving productivity is essential.
- Sustaining Spices Productivity:
- Rajasthan is a major producer of spices, and while productivity has remained relatively strong, the recent decline in 2022-23 calls for attention. Investing in more resilient spice varieties and improved farming practices could help sustain and boost productivity levels.
Conclusion
The data shows substantial growth in the area under cultivation for fruits, vegetables, and spices, reflecting increased market demand and government support for diversified agriculture. However, productivity trends for fruits and spices suggest challenges in maintaining or increasing yields despite larger cultivation areas. Addressing these challenges through better agricultural techniques, investments in high-yield varieties, and improved farming infrastructure will be essential for Rajasthan to optimize its agricultural productivity in the long term.
Table 2.8

Analytical Summary
This table presents the classification of blocks (administrative regions) in Rajasthan into various water-related categories based on the availability and sustainability of groundwater resources for the years 2022 and 2023.
Key Data Points
- Safe Blocks:
- 2022: 38 blocks
- 2023: 38 blocks
- Insight: The number of safe blocks has remained constant at 38 from 2022 to 2023. These are blocks where groundwater extraction is within sustainable limits, and there is no immediate threat to water resources.
- Semi-Critical Blocks:
- 2022: 20 blocks
- 2023: 22 blocks
- Insight: The number of semi-critical blocks increased from 20 in 2022 to 22 in 2023. These are blocks where groundwater extraction is approaching critical levels, and careful management is required to prevent further degradation.
- Critical Blocks:
- 2022: 22 blocks
- 2023: 23 blocks
- Insight: The number of critical blocks increased slightly from 22 in 2022 to 23 in 2023. These areas are experiencing high groundwater extraction rates, with a risk of water scarcity if extraction continues without intervention.
- Overexploited Blocks:
- 2022: 219 blocks
- 2023: 216 blocks
- Insight: The number of overexploited blocks decreased slightly from 219 in 2022 to 216 in 2023. Overexploited blocks face severe water stress, where groundwater extraction exceeds the replenishment rate, posing significant challenges for water security.
- Saline Blocks:
- 2022: 3 blocks
- 2023: 3 blocks
- Insight: The number of saline blocks has remained steady at 3 in both years. These blocks have saline groundwater, making it unsuitable for agricultural or drinking purposes without treatment.
Key Observations
- Stable Safe and Saline Blocks:
- The number of safe and saline blocks remained unchanged between 2022 and 2023, indicating stable conditions in areas with sufficient water resources and in areas affected by salinity.
- Increase in Semi-Critical and Critical Blocks:
- There is a slight increase in the number of semi-critical and critical blocks, suggesting that more areas are nearing unsustainable levels of groundwater extraction. This trend highlights the need for proactive water management strategies in these regions.
- Decrease in Overexploited Blocks:
- The slight decrease in overexploited blocks from 219 to 216 is a positive sign, suggesting that some regions may have improved their groundwater management practices or benefited from conservation efforts. However, the number of overexploited blocks remains alarmingly high.
Key Insights
- Urgent Need for Water Management in Overexploited Areas:
- With 216 blocks still classified as overexploited, immediate interventions are required to prevent further groundwater depletion. This could involve adopting rainwater harvesting, better irrigation practices, and policies to regulate groundwater extraction.
- Focus on Semi-Critical and Critical Areas:
- The rise in semi-critical and critical blocks indicates that these areas are on the verge of becoming overexploited. Targeted water conservation and efficient usage strategies could prevent them from falling into the overexploited category.
- Sustainability in Safe Zones:
- Maintaining the number of safe blocks is crucial for long-term water security. Efforts should be made to ensure that these blocks continue to manage water resources effectively, serving as models for other regions.
Conclusion
The data on the classification of blocks in Rajasthan underscores the critical need for effective groundwater management, particularly in overexploited and critical areas. While there has been a slight improvement in reducing the number of overexploited blocks, the overall picture points to growing stress on groundwater resources across the state. Sustainable practices and policies are essential to safeguarding water resources for future generations.
Table 2.9
Analytical Summary
This table outlines the achievements made by the Rajasthan State Warehousing Corporation over five years, focusing on key aspects such as storage capacity, utilization, and constructed storage capacity. The data also provides insight into the financial performance of the corporation.
Key Data Points
- Average Storage Capacity (Lakh MT):
- 2019-20: 14.69 Lakh MT
- 2023-24: 16.79 Lakh MT
- Insight: The average storage capacity has steadily increased over the years, from 14.69 Lakh MT in 2019-20 to 16.79 Lakh MT in 2023-24. This indicates an expansion of warehousing infrastructure to accommodate more agricultural produce and other commodities.
- Average Utilization (Lakh MT):
- 2019-20: 14.63 Lakh MT
- 2023-24: 7.37 Lakh MT (tentative)
- Insight: Despite the increase in storage capacity, average utilization has fluctuated, peaking at 14.73 Lakh MT in 2020-21 but dropping to 7.37 Lakh MT in 2023-24. This drop in utilization indicates that the available capacity is not being fully used in recent years.
- Percentage of Average Utilization:
- 2019-20: 100%
- 2023-24: 44%
- Insight: The percentage of utilization has fallen drastically from 100% in 2019-20 to 44% in 2023-24. This decline suggests inefficiencies or reduced demand for storage services, which could be due to a variety of factors such as crop yield fluctuations, market changes, or operational challenges.
- Constructed Storage Capacity (Lakh MT):
- 2019-20: 0.16 Lakh MT
- 2023-24: 0.71 Lakh MT
- Insight: The corporation has steadily constructed additional storage capacity over the years, with the largest increase in 2021-22 (2.24 Lakh MT). However, construction slowed to 0.71 Lakh MT in 2023-24.
- Number of Warehouses:
- Consistent: 93 warehouses (2019-20 to 2023-24)
- Insight: The number of warehouses has remained constant at 93 over the entire period, suggesting that the corporation has focused on improving or expanding existing facilities rather than opening new ones.
- Total Income (₹ in Lakh):
- 2019-20: ₹23,443.32 Lakh
- 2023-24: ₹14,313.27 Lakh (tentative)
- Insight: The total income peaked in 2020-21 at ₹29,114.77 Lakh but has since decreased significantly, with tentative income for 2023-24 standing at ₹14,313.27 Lakh. The decline in income correlates with the reduced utilization rates, indicating that underutilization of storage capacity has impacted revenue.
Key Observations
- Declining Utilization Rates:
- While the storage capacity has steadily increased, the utilization rates have fallen sharply from 100% in 2019-20 to 44% in 2023-24. This suggests that the available storage capacity is not being fully utilized, which could be due to decreased agricultural output, changes in storage demand, or operational inefficiencies.
- Steady Increase in Storage Capacity:
- The corporation has consistently increased its storage capacity, adding more constructed storage each year, especially in 2021-22. Despite this expansion, the corresponding utilization of these facilities has not kept pace, reflecting a possible mismatch between supply and demand.
- Stagnant Number of Warehouses:
- The number of warehouses has remained constant at 93. This consistency suggests that the focus has been on expanding capacity within existing warehouses rather than building new ones, perhaps to optimize resource use.
- Declining Revenue:
- The corporation’s total income has fallen in recent years, from a high of ₹29,114.77 Lakh in 2020-21 to a tentative ₹14,313.27 Lakh in 2023-24. The drop in revenue aligns with the reduced utilization rates, highlighting the direct financial impact of underutilized storage capacity.
Key Insights
- Need to Improve Utilization:
- The sharp decline in utilization rates indicates inefficiencies or reduced demand for warehousing services. Efforts should be made to attract more clients or crops for storage, possibly by improving service offerings, reducing costs, or offering additional services such as inventory management or cold storage.
- Exploring New Revenue Streams:
- Given the decline in total income, the corporation may need to explore new business models or revenue streams to offset the underutilization of storage facilities. This could include offering logistics services, partnering with private firms, or expanding into value-added services like processing or packaging.
- Matching Capacity with Demand:
- The mismatch between increased storage capacity and lower utilization suggests a need for better alignment between capacity expansion and actual demand. A market study could help the corporation understand current trends and adjust its operations accordingly to avoid overbuilding.
- Focus on Operational Efficiency:
- As the number of warehouses has remained stagnant, efforts should be concentrated on maximizing the operational efficiency of these 93 warehouses. This includes upgrading technology, improving inventory systems, and offering flexible storage options to attract more users.
Conclusion
The Rajasthan State Warehousing Corporation has made significant strides in increasing its storage capacity, but the declining utilization rates and revenue signal challenges in aligning capacity with demand. Improving the efficiency of existing warehouses, exploring new revenue opportunities, and boosting utilization rates will be key to ensuring the corporation’s long-term success.
Table 2.10
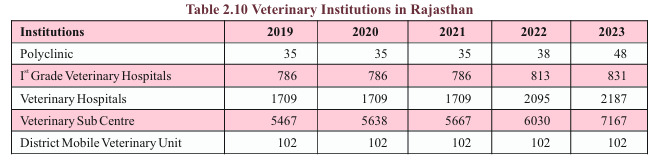
Analytical Summary
This table outlines the growth of various veterinary institutions in Rajasthan between 2019 and 2023, providing insights into the expansion of animal healthcare services in the state.
Key Data Points:
- Polyclinics:
- 2019-2021: 35 polyclinics
- 2023: 48 polyclinics
- Insight: The number of polyclinics has increased from 35 in 2019-2021 to 48 in 2023, indicating a growth in multi-specialty animal healthcare facilities. This rise suggests an increased focus on providing comprehensive veterinary services in the state.
- 1st Grade Veterinary Hospitals:
- 2019-2021: 786 hospitals
- 2023: 831 hospitals
- Insight: The number of 1st Grade Veterinary Hospitals increased from 786 in 2019-2021 to 831 in 2023. These hospitals offer a higher level of veterinary care, showing Rajasthan’s commitment to improving the quality of animal healthcare.
- Veterinary Hospitals:
- 2019-2021: 1,709 hospitals
- 2023: 2,187 hospitals
- Insight: The number of Veterinary Hospitals has increased significantly from 1,709 in 2019-2021 to 2,187 in 2023. This growth reflects the expansion of basic animal healthcare facilities across the state, providing greater access to veterinary services.
- Veterinary Sub-Centres:
- 2019: 5,467 sub-centres
- 2023: 7,167 sub-centres
- Insight: Veterinary Sub-Centres, which serve rural and remote areas, have seen the largest growth, increasing from 5,467 in 2019 to 7,167 in 2023. This substantial rise indicates a strong focus on decentralizing veterinary care and ensuring accessibility for livestock in rural areas.
- District Mobile Veterinary Units:
- 2019-2023: 102 units
- Insight: The number of District Mobile Veterinary Units has remained constant at 102 over the five-year period. These mobile units play a critical role in reaching remote areas with veterinary services, but the stagnant number suggests there may be room for further expansion.
Key Observations
- Rapid Expansion of Veterinary Services:
- The number of Veterinary Hospitals and Veterinary Sub-Centres has grown significantly between 2019 and 2023, reflecting Rajasthan’s efforts to expand its veterinary healthcare infrastructure. This is particularly important given the state’s large livestock population.
- Stagnation in Mobile Veterinary Units:
- Despite the overall growth in veterinary institutions, the number of District Mobile Veterinary Units has not increased over the five years. Given Rajasthan’s large rural and remote areas, expanding mobile veterinary units could further enhance access to veterinary services in underserved regions.
- Focus on Decentralized Care:
- The significant increase in Veterinary Sub-Centres shows a concerted effort to decentralize animal healthcare, particularly in rural areas. This is crucial for improving livestock health in regions that may not have easy access to higher-level veterinary hospitals.
Key Insights
- Need for More Mobile Units:
- Given that Rajasthan has expanded its stationary veterinary institutions significantly, adding more mobile veterinary units could complement these efforts and ensure that even the most remote livestock-owning communities receive timely care.
- Investment in Polyclinics:
- The increase in the number of polyclinics suggests that Rajasthan is investing in more comprehensive veterinary services that offer a range of treatments under one roof. These polyclinics are important for providing advanced care and could become a key part of the state’s veterinary infrastructure.
- Steady Growth in First-Grade Hospitals:
- The modest but steady increase in 1st Grade Veterinary Hospitals shows that Rajasthan is prioritizing higher-quality veterinary care. Further investment in these hospitals could help improve the overall standard of animal healthcare in the state.
Conclusion
Rajasthan has made considerable strides in expanding its veterinary healthcare infrastructure over the last five years, with significant growth in both Veterinary Hospitals and Sub-Centres. However, the District Mobile Veterinary Units remain stagnant, indicating a potential area for further investment to ensure that even remote areas benefit from these improvements. Overall, the state is moving towards providing more comprehensive and accessible veterinary services to support its livestock-dependent economy.
Table 2.11
Analytical Summary
This table presents the annual production figures for milk, meat, eggs, and wool in Rajasthan from 2018-19 to 2022-23, reflecting the growth in the livestock sector over five years.
Key Data Points
- Milk Production (Thousand Tonnes):
- 2018-19: 23,668 thousand tonnes
- 2022-23: 33,307 thousand tonnes
- Insight: Milk production has increased significantly, rising by over 40% from 23,668 thousand tonnes in 2018-19 to 33,307 thousand tonnes in 2022-23. This substantial growth highlights the expansion of the dairy sector in Rajasthan, likely driven by improved dairy farming practices, better livestock breeds, and government support.
- Meat Production (Thousand Tonnes):
- 2018-19: 192 thousand tonnes
- 2022-23: 240 thousand tonnes
- Insight: Meat production has also steadily increased, from 192 thousand tonnes in 2018-19 to 240 thousand tonnes in 2022-23. This growth may be attributed to increased demand for meat products and the rising commercialization of livestock rearing for meat purposes.
- Egg Production (Millions):
- 2018-19: 1,662 million eggs
- 2022-23: 2,761 million eggs
- Insight: The production of eggs has surged by approximately 66%, from 1,662 million in 2018-19 to 2,761 million in 2022-23. The sharp rise in egg production reflects the growing poultry sector, supported by improved breeding techniques and increased demand for eggs as a protein source.
- Wool Production (Lakh Kg):
- 2018-19: 145 lakh kg
- 2022-23: 161 lakh kg
- Insight: Wool production has seen a modest increase over the years, rising from 145 lakh kg in 2018-19 to 161 lakh kg in 2022-23. Although the growth is relatively small compared to other livestock products, it highlights the continued importance of wool production in Rajasthan, where sheep farming remains a traditional practice.
Key Observations
- Rapid Growth in Milk Production:
- Milk production has seen the most significant increase over the five-year period, reflecting Rajasthan’s prominent role as a major dairy-producing state in India. The growth indicates improvements in dairy farming, better cattle breeds, and expanded dairy infrastructure.
- Steady Increase in Meat and Egg Production:
- Both meat and egg production have increased steadily, with the rise in egg production being particularly notable. This suggests that Rajasthan’s poultry and meat sectors are expanding to meet rising consumer demand for protein sources.
- Relatively Stable Wool Production:
- Although wool production has increased, the growth has been slower compared to other livestock products. Wool remains an important product, but it may not be expanding as rapidly due to competition from synthetic fibers and changes in consumer preferences.
Key Insights
- Milk Sector as a Major Contributor:
- The sharp increase in milk production solidifies Rajasthan’s position as a key dairy-producing state. The state’s focus on dairy development programs, cooperative models, and livestock management practices has paid off, contributing to rural livelihoods and the overall economy.
- Potential for Further Growth in Meat and Poultry:
- The steady growth in meat and egg production indicates that these sectors have room for further expansion. Investments in poultry farms, cold storage facilities, and meat processing could enhance Rajasthan’s capacity to meet both domestic and export demand.
- Wool Industry’s Slow Growth:
- The slower growth in wool production suggests that the sector may be facing challenges such as declining demand, competition from alternative materials, or a lack of investment in modern wool processing techniques. Addressing these issues could help revitalize wool production.
Conclusion
The livestock sector in Rajasthan has shown considerable growth, particularly in milk and egg production, which have expanded significantly over the last five years. While meat production is also growing steadily, the wool sector has seen more modest gains. Overall, the data reflects the importance of livestock to the state’s economy and suggests opportunities for further development, especially in the poultry and meat industries.
Table 2.12
Analytical Summary
This table outlines the achievements of various dairy-related activities in Rajasthan for the year 2023-24, comparing targeted versus actual achievements for key metrics such as milk procurement, milk marketing, and artificial insemination.
Key Data Points
- Average Milk Procurement (Lakh Kg per Day):
- Target: 41.12 lakh kg/day
- Achievement: 33.63 lakh kg/day
- Percentage Achieved: 81.79%
- Insight: The milk procurement rate reached 33.63 lakh kg/day, achieving approximately 82% of the target. While the procurement rate is strong, it falls short of the goal, possibly indicating challenges in milk collection efficiency or supply chain issues.
- Average Milk Marketing (Lakh Litres per Day):
- Target: 26.42 lakh litres/day
- Achievement: 22.37 lakh litres/day
- Percentage Achieved: 84.65%
- Insight: Milk marketing also achieved nearly 85% of the target, reaching 22.37 lakh litres/day. The gap between the target and achievement suggests room for improvement in marketing efforts, distribution networks, or market demand.
- Cattle Feed Sale (Union) (000′ MT):
- Target: 420,000 MT
- Achievement: 321,000 MT
- Percentage Achieved: 76.43%
- Insight: Cattle feed sales reached 321,000 MT, which is 76% of the target. This shortfall may be due to fluctuations in demand, financial constraints of farmers, or logistical challenges in distributing feed.
- Revived Societies:
- Target: 1,455 societies
- Achievement: 461 societies
- Percentage Achieved: 31.69%
- Insight: The number of revived dairy societies fell significantly short, with only 31.69% of the target met. This indicates difficulties in reviving dormant societies, which could be due to structural, administrative, or financial barriers.
- New Societies:
- Target: 1,630 new societies
- Achievement: 645 new societies
- Percentage Achieved: 39.57%
- Insight: New dairy societies also fell short of the target, with only 645 societies established compared to a target of 1,630. This could reflect challenges in mobilizing new cooperative ventures or establishing societies in rural areas.
- Artificial and Natural Insemination (000′ Numbers):
- Target: 496,000 inseminations
- Achievement: 323,000 inseminations
- Percentage Achieved: 65.12%
- Insight: The number of artificial and natural inseminations reached 323,000, about 65% of the target. This gap indicates potential limitations in veterinary services, farmer awareness, or access to insemination facilities.
Key Observations
- Strong Performance in Milk Procurement and Marketing:
- The milk procurement and milk marketing activities have achieved over 80% of their targets, reflecting solid performance in the dairy sector. However, these metrics also highlight potential inefficiencies in collection and marketing that need addressing to meet full targets.
- Challenges in Cattle Feed Sales:
- Cattle feed sales reached 76% of the target, suggesting that more effort is needed to meet the nutritional needs of livestock through increased feed distribution, perhaps by addressing affordability or supply chain issues.
- Low Success in Establishing and Reviving Societies:
- Both reviving existing societies and establishing new societies have fallen well short of their targets, with only about 31% and 40% of the goals met, respectively. This could be due to a lack of infrastructure, organizational challenges, or insufficient funding and support for cooperative societies.
- Insemination Services Need Strengthening:
- The relatively low achievement rate (65%) for artificial and natural insemination suggests that more focus is needed on enhancing these services, which are critical for improving livestock productivity and breeding efficiency.
Key Insights
- Focus on Expanding Dairy Cooperative Societies:
- The low achievement in both reviving old societies and establishing new ones highlights the need for stronger institutional support, financial incentives, and community engagement to build a robust cooperative network in the dairy sector.
- Improving Milk Collection and Marketing Networks:
- While milk procurement and marketing are performing well, there is still room for optimization in both areas. Strengthening transportation infrastructure, cold chain management, and rural collection centers could help bridge the gap between the targets and achievements.
- Promote Insemination Programs:
- The gap in artificial and natural insemination services suggests a need for more veterinary outreach, farmer education, and accessibility to reproductive services, which are crucial for boosting dairy productivity.
Conclusion
Rajasthan’s dairy sector has shown solid progress in terms of milk procurement and marketing, but challenges remain in other areas such as society development, cattle feed distribution, and livestock insemination services. Addressing these gaps will be essential for the state to meet its targets and sustain long-term growth in the dairy industry.
Table 2.13

Analytical Summary
This table presents the data for fish production (in metric tonnes) and fish seed production (in million fry) in Rajasthan over the period from 2019-20 to 2023-24.
Key Data Points
- Fish Production (Metric Tonnes):
- 2019-20: 58,138.21 metric tonnes
- 2023-24: 91,349.43 metric tonnes
- Insight: There has been a significant rise in fish production over the five-year period, increasing by 57% from 58,138.21 metric tonnes in 2019-20 to 91,349.43 metric tonnes in 2023-24. This reflects the successful expansion of the fisheries sector in Rajasthan, likely due to the adoption of better aquaculture practices, improved infrastructure, and government initiatives to promote fish farming.
- Fish Seed Production (Million Fry):
- 2019-20: 1,226.41 million fry
- 2023-24: 1,364.00 million fry
- Insight: Fish seed production has increased from 1,226.41 million fry in 2019-20 to 1,364.00 million fry in 2023-24. This 11% growth in seed production indicates that the fisheries sector has been investing in the development of seed infrastructure to sustain the growth of fish farming.
Key Observations
- Steady Growth in Fish Production:
- Fish production has shown consistent growth over the five years, with a particularly sharp increase in the last two years. The increase from 79,286.40 metric tonnes in 2022-23 to 91,349.43 metric tonnes in 2023-24 is a testament to the expanding fish farming activities in Rajasthan.
- Increase in Fish Seed Production:
- The rise in fish seed production has been more moderate compared to fish production, but it has kept pace with the growing demand for fry needed to support the aquaculture sector. This suggests that fish seed infrastructure is improving to support the rising fish production.
- Significant Increase in Recent Years:
- The sharp rise in fish production between 2021-22 and 2023-24 highlights the impact of increased focus on aquaculture development, possibly driven by government policies, incentives for fish farmers, and improvements in fish farming techniques.
Key Insights
- Sustaining Fish Production Growth:
- The rapid increase in fish production suggests that the sector is on a positive trajectory. Continued investments in infrastructure, training for fish farmers, and efficient fish farming practices will be crucial to sustain this growth.
- Expanding Fish Seed Infrastructure:
- Given that fish seed production has also increased, expanding hatcheries and seed distribution networks will be critical to ensuring the availability of high-quality seeds. This will help meet the growing demands of fish farmers and ensure consistent fish production.
- Government and Private Sector Collaboration:
- The growth in both fish and seed production likely reflects a combination of government support and private sector participation. Encouraging further collaboration between these sectors could help Rajasthan establish itself as a leader in inland fish farming.
Conclusion
The fisheries sector in Rajasthan has seen impressive growth over the last five years, with substantial increases in both fish production and fish seed production. This growth highlights the sector’s potential to contribute to the state’s economy and improve livelihoods in rural areas. However, continued focus on improving fish seed infrastructure and aquaculture practices will be essential to maintain the momentum and meet the growing demand for fish in the region.