
Chapter 5
Infrastructure is the backbone of economic growth and social development. It encompasses a wide range of physical assets, including roads, energy systems, transportation networks, and communication services, all of which are essential for fostering economic activities and improving the quality of life. Chapter 5 delves into the critical role of infrastructure in shaping the development trajectory of Rajasthan, emphasizing the state’s strategic investments in power generation, road construction, public transportation, renewable energy, and disaster management.
Rajasthan’s infrastructure development is marked by continuous efforts to enhance energy security, improve connectivity, and ensure sustainable growth. The state government has been proactive in expanding its power generation capacity, especially through renewable energy sources like solar and wind, taking advantage of the state’s vast natural resources. Simultaneously, the expansion of road networks and improvements in public transport are aimed at facilitating easier access to essential services, markets, and employment opportunities, particularly in rural and remote areas.
This chapter highlights the critical infrastructure projects that have been undertaken, including the development of expressways, smart grids, and renewable energy parks, while also examining the impact of telecommunications and disaster management strategies on the state’s overall resilience. The chapter underscores the state’s commitment to aligning its infrastructure goals with national priorities, such as sustainability, digitization, and inclusive growth, ensuring Rajasthan’s progress toward becoming a key economic hub in India.
- Power Sector
- Power Generation Sources:
- Thermal Power: Rajasthan’s thermal power infrastructure is primarily centered around projects such as Kota, Suratgarh, Chhabra, and Kalisindh Thermal Plants, which serve as the backbone of energy production in the state.
- Hydel Projects: Hydel projects, such as Mahi, Bhakra, and Chambal, contribute significantly to the state’s power grid through interstate collaborations.
- Renewables (Wind, Solar, Biomass): Rajasthan has strategically invested in solar and wind energy to reduce dependency on fossil fuels. The Bhadla Solar Park in Jodhpur, with a capacity of 2,245 MW, is among the world’s largest solar installations, positioning the state as a leader in renewable energy production.
- Installed Capacity (2024):
- The installed power generation capacity increased to 24,783.64 MW by March 2024, up from 21,175.90 MW in 2019-20. The transition toward renewable energy is evident in the growth of solar power capacity from 2,178 MW (2019-20) to 4,010.50 MW (2023-24).
- Renewable Energy’s Share: Solar and wind energy projects now account for a significant share of Rajasthan’s energy mix. The growth in renewable sources aligns with national efforts to achieve carbon neutrality and reduce greenhouse gas emissions.
- Objective Analysis: The continuous expansion in solar and wind capacity demonstrates Rajasthan’s proactive approach to addressing energy security and sustainability challenges, reducing its reliance on thermal power, and benefiting from its natural solar and wind potential.
- Energy Consumption and Availability:
- Energy availability in Rajasthan grew by 61.86% from 6,922 crore units (2016-17) to 11,204 crore units (2023-24), while energy consumption increased by 64.41%. This surge in demand is linked to the growing industrialization, urbanization, and electrification of rural areas.
- Innovative Power Schemes:
- The Smart Transmission Network and Asset Management System (STNAMS) enhances grid monitoring and management. This initiative aims to improve predictive assessment of grid stability and ensure efficient energy delivery across the state.
- The state’s focus on private sector participation in both transmission and generation projects under Public-Private Partnership (PPP) models has led to improved operational efficiencies and resource allocation.
- Objective Insight: Rajasthan’s focus on expanding renewable energy is strategically aligned with India’s national goals of reducing carbon emissions and increasing the share of renewables in the energy mix. By tapping into its solar and wind potential, the state ensures a more sustainable, resilient, and future-proof energy grid.
- Road Infrastructure
- Expansion of Road Network:
- Rajasthan’s road network expanded from 13,553 km in 1949 to 3,01,810.86 km by March 2023. The state’s road density is 88.18 km per 100 sq. km, still behind the national average of 165.24 km per 100 sq. km.
- Objective Challenge: While Rajasthan’s road expansion is commendable, the lower road density compared to the national average indicates that rural and remote areas still require better connectivity, and additional investment is necessary to bridge this gap.
- Key Ongoing Projects:
- Expressways and Highways: Rajasthan aims to become the expressway capital of India. Projects like the Jaipur-Jodhpur Four-Lane Highway and the Chambal Expressway are expected to significantly reduce travel time and enhance logistical efficiency.
- Ring Roads and Flyovers: The construction of ring roads in cities like Jodhpur and other urban centers, alongside new flyovers, aims to decongest traffic and improve urban mobility.
- Financial Commitments: Rajasthan has allocated over ₹10,000 crore for road construction and maintenance over the next five years. Additionally, 14 Road Over Bridges (ROBs) are under development to further streamline road transportation.
- Widening and Strengthening Projects:
- The state completed 6,509 km of new roads and black-topping in 2023-24, with additional focus on connecting 153 villages with populations over 500 people. In tribal and desert areas, 1,360 km of roads were constructed under NABARD and rural development schemes.
- Objective Insight: The increased road infrastructure development is critical not only for economic integration but also for improving access to education, healthcare, and markets, particularly in rural and tribal areas.
- Transportation Sector
- Vehicle Registration Trends:
- The number of registered vehicles grew from 11,72,956 in 2019-20 to 15,74,956 in 2023-24, reflecting a 34.3% increase. This growth underscores the state’s increasing reliance on private and commercial vehicles, driven by urbanization, rising incomes, and better connectivity.
- Revenue Generation: The transport sector contributed ₹6,703.59 crore in revenue in 2023-24, a 9.39% increase from the previous year. This shows an upward trend in state revenues from transportation taxes and fees.
- Public Transport:
- Rajasthan State Road Transport Corporation (RSRTC) operates a fleet of 3,665 buses, covering 12.63 lakh km per day and serving 7.18 lakh passengers. Despite challenges like rising operational costs, RSRTC’s bus fleet plays a critical role in ensuring affordable public transportation across the state.
- Innovations: RSRTC has introduced vehicle tracking systems and panic buttons for women’s safety. These innovations contribute to passenger safety and operational efficiency.
- Objective Analysis: The growing vehicle registrations and revenue generation indicate improved access to motorized transport and economic mobility. However, the public transport sector must keep pace with private vehicle growth to reduce urban congestion and promote sustainable transport solutions.
- Renewable Energy Initiatives
- Solar Energy:
- Rajasthan has the highest solar potential in India, with 142 GW of potential power generation. The state had installed 19,459 MW of solar energy by March 2024, up from 15,000 MW in 2020.
- The Bhadla Solar Park (2,245 MW) is the world’s largest solar park, making Rajasthan a global leader in green energy.
- Wind Energy:
- Wind energy capacity in the state stands at 5,209 MW, with immense potential for further development. Rajasthan benefits from favorable wind conditions in areas like Jaisalmer and Barmer.
- Biomass Energy:
- Biomass power generation remains relatively small, with an installed capacity of 128.45 MW, using mustard husk and other agricultural by-products. However, only 105 MW of this is currently operational, indicating the need for efficiency improvements in this sector.
- Objective Insights: Rajasthan’s heavy investments in renewables align with global trends toward decarbonization. The development of solar and wind energy reduces reliance on coal-based thermal power and positions the state as a key player in India’s green energy future.
- Telecommunications and Postal Services
- Telecommunication Infrastructure:
- Rajasthan had 6.70 crore telecom subscribers by March 2024, up from 6.44 crore in 2022-23. The increase in telecom subscribers is linked to the expansion of digital services and the growing need for remote communication across rural and urban areas.
- Postal Services: The state had 11,049 post offices by 2024, with the majority located in rural areas, highlighting efforts to improve connectivity in remote regions.
- Innovative Digital Solutions:
- The government introduced e-licensing, online vehicle fitness tests, and a Road Safety Web Portal, marking significant strides in digitizing transport services and enhancing public safety.
- Disaster Management
- State Disaster Response Fund (SDRF):
- Rajasthan’s SDRF had ₹5,185.32 crore available in 2023-24, with ₹2,203.83 crore allocated for key disaster response activities, including agricultural subsidies, water relief, and cattle conservation in drought-affected areas.
- Emergency Response Support System (ERSS-112):
- A centralized emergency response system (ERSS-112) has been established to handle disaster-related calls, improving the state’s disaster preparedness and response mechanisms.
- Objective Insight: The focus on disaster management, including the allocation of substantial financial resources, reflects Rajasthan’s proactive approach to dealing with natural disasters such as droughts and lightning strikes, which frequently impact the state’s rural communities.
Conclusion
Rajasthan’s infrastructure development serves as a critical foundation for its economic, social, and environmental progress. The state’s strategic focus on enhancing its power generation, road networks, transportation systems, and telecommunication infrastructure reflects its commitment to achieving sustainable and inclusive growth. Below are the key takeaways and conclusions from the chapter:
- Significant Growth in Power Sector:
- Installed Capacity Expansion: Rajasthan’s power generation capacity has expanded to 24,783.64 MW (2024), demonstrating significant growth over the past five years, with increased reliance on renewable energy sources like solar and wind.
- Diversified Energy Mix: The state’s focus on transitioning to renewable energy (solar, wind, biomass) is critical in reducing dependence on traditional fossil fuels, making Rajasthan a national leader in green energy.
- Improved Transmission Systems: The expansion of the Extra High Voltage (EHV) transmission network and the implementation of smart grid technologies indicate that Rajasthan is prioritizing modernization and efficiency in its energy infrastructure.
- Development of Road Infrastructure:
- Expanding Road Networks: With 3,01,810.86 km of roads by 2023, Rajasthan has made significant strides in building road infrastructure, which is essential for connecting rural areas to urban centers, facilitating trade, and improving access to services.
- Challenges in Road Density: Although the road network has grown, the road density (88.18 km per 100 sq. km) still lags behind the national average, underscoring the need for continued investments, particularly in rural and tribal regions.
- Focus on Expressways and Highways: Key projects like the Chambal Expressway and Jaipur-Jodhpur Four-Lane Highway are designed to improve transportation efficiency, reduce travel time, and bolster the state’s role as a logistical hub.
- Progress in Public Transportation and Mobility:
- Rising Vehicle Ownership: With vehicle registrations growing to 15,74,956 in 2024, there is clear evidence of increasing mobility and economic activity in the state. However, this also places pressure on road infrastructure and calls for more sustainable urban transport solutions.
- Public Transport Improvements: The Rajasthan State Road Transport Corporation (RSRTC) has introduced innovations like vehicle tracking systems and panic buttons for women’s safety, enhancing service efficiency and safety for passengers.
- Balanced Growth in Private and Public Transport: While the rise in private vehicle ownership is notable, there is a continued focus on expanding and modernizing public transport to ensure affordable and reliable services for all segments of society.
- Leadership in Renewable Energy:
- Solar and Wind Energy: Rajasthan is now a national leader in solar energy, with a total capacity of 19,459 MW by 2024. The Bhadla Solar Park, one of the largest in the world, and the growing wind energy sector underscore Rajasthan’s commitment to sustainable energy.
- Biomass Energy: Although smaller in scale, biomass energy plays an important role in the state’s renewable energy portfolio, with the potential to expand through better operational efficiencies and greater investment.
- PM-KUSUM Scheme: Through the PM-KUSUM scheme, the state is empowering farmers with decentralized solar power solutions, improving energy access in rural areas and reducing dependency on conventional electricity grids.
- Enhancement in Telecommunication and Digital Infrastructure:
- Telecom Growth: With 6.70 crore telecom subscribers by 2024, Rajasthan’s telecom infrastructure has expanded rapidly, enhancing digital connectivity across rural and urban areas.
- Digital Innovations in Public Services: Initiatives like e-licensing, online vehicle fitness tests, and the Road Safety Web Portal mark significant advancements in digitizing public services, improving efficiency, and enhancing public safety.
- Resilient Disaster Management Systems:
- State Disaster Response Fund (SDRF): Rajasthan’s SDRF, with an allocation of ₹5,185.32 crore in 2023-24, demonstrates a strong commitment to disaster preparedness and relief, particularly in managing droughts and lightning strikes.
- Emergency Response Infrastructure: The establishment of the Emergency Response Support System (ERSS-112) enhances the state’s ability to respond swiftly to disasters and emergencies, thereby improving overall resilience.
- Challenges and Areas for Future Development:
- Rural Connectivity: Although Rajasthan has made significant progress in expanding road infrastructure, rural and remote areas still need better connectivity to reach the state’s economic development goals.
- Sustainable Transportation Solutions: As the number of vehicles continues to rise, there is an urgent need for more sustainable and environmentally friendly transport solutions, particularly in urban centers where congestion and pollution are growing concerns.
- Continued Investment in Renewable Energy: While the state has made remarkable progress in renewable energy, continued investment in solar, wind, and biomass projects will be critical to meet future energy demands and support India’s national goals for clean energy.
Final Thoughts
- Power and Energy: Rajasthan has successfully diversified its energy portfolio, leading the way in renewable energy adoption and making strides in modernizing its transmission networks.
- Roads and Connectivity: Expanding and improving road infrastructure remains a priority, particularly in rural and tribal areas, to ensure economic integration and access to services.
- Public Transport and Mobility: The rise in both private vehicle ownership and innovations in public transport indicates a balanced focus on enhancing mobility across the state.
- Telecommunication and Digitalization: Expanding digital services and improving connectivity are crucial for both rural development and urban modernization.
- Disaster Resilience: Rajasthan’s strong disaster management framework reflects a proactive approach to mitigating risks and ensuring timely response to emergencies.
- Challenges Ahead: Future development will require ongoing investments in sustainable infrastructure, particularly in roads, transport, and energy sectors, to meet the growing demands of an increasingly urban and mobile population.
In conclusion, Rajasthan’s infrastructure development over recent years has laid a solid foundation for economic growth, sustainability, and social inclusion. By focusing on renewable energy, enhancing road networks, modernizing public transport, and strengthening disaster resilience, the state is well-positioned to continue its upward development trajectory, meeting both national and global challenges in the coming decades.
Chapter 5
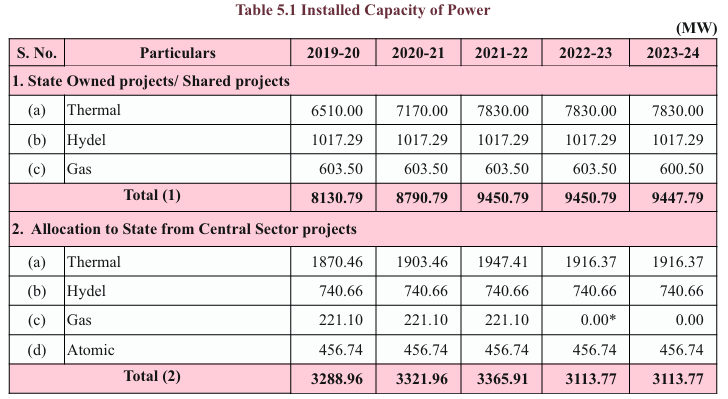
Table 5.1
Analytical Summary
This table outlines the installed power capacity of the state across different power generation sources from 2019-20 to 2023-24, split between state-owned/shared projects and central sector projects. The power generation categories include thermal, hydel, gas, and atomic energy, reflecting the state’s diversified energy mix.
Key Data Points
- State-Owned Projects/Shared Projects:
- Thermal: Growth from 6510 MW in 2019-20 to a stable 7830 MW from 2021-22 onward.
- Hydel (Hydropower): Constant at 1017.29 MW from 2019-20 to 2023-24.
- Gas: Marginal decrease from 603.50 MW to 600.50 MW in 2023-24.
- Total Installed Capacity (State-Owned): Rises from 8130.79 MW in 2019-20 to 9450.79 MW in 2021-22, with a slight reduction in 2023-24 to 9447.79 MW.
- Allocation from Central Sector Projects:
- Thermal: Gradual increase from 1870.46 MW to 1947.41 MW in 2021-22, followed by a slight decrease to 1916.37 MW.
- Hydel: Constant at 740.66 MW throughout the period.
- Gas: The capacity drops to 0 in 2022-23 and 2023-24.
- Atomic: Remains steady at 456.74 MW.
- Total Installed Capacity (Central Allocation): Peaks at 3365.91 MW in 2021-22 and drops to 3113.77 MW in 2022-23 and 2023-24.
Key Observations
- Thermal power remains the backbone of the state’s power generation, contributing the largest share in both state-owned projects and central allocation. It shows stability after a significant increase from 2019-20 to 2021-22.
- Hydel power has been constant, with no increase in capacity across the years. This could suggest limited scope for expansion in hydropower projects.
- Gas power generation shows a sharp decline in allocation from the central sector, becoming negligible by 2023-24. The state might be transitioning away from gas-based power generation.
- Atomic energy remains a small but stable part of the state’s energy mix, with no significant changes in capacity allocation.
- Overall power capacity from both state and central sources has increased, peaking around 2021-22, but there is a slight decline in subsequent years.
Key Terms
- Thermal Power: Energy generated from the combustion of fossil fuels like coal, oil, and natural gas.
- Hydel (Hydropower): Electricity generated by using the energy of falling water or fast-running water.
- Gas Power: Power generated by burning natural gas in gas turbines.
- Atomic Power: Electricity produced by nuclear reactors using uranium as a fuel source.
- MW (Megawatt): A unit of power, with 1 MW equal to 1 million watts.
Key Insights
- The state’s energy strategy appears to focus heavily on thermal power, reflecting reliance on traditional energy sources like coal.
- Hydel and atomic energy show no signs of significant investment or expansion, remaining stable throughout the years.
- The drop in gas power capacity from the central sector allocation may reflect shifts toward more renewable or efficient sources.
- The overall slight decline in total capacity from both state and central allocations in the later years might suggest challenges in expanding the power generation infrastructure.
Conclusion
The state’s power generation capacity has seen notable growth, especially in thermal power generation. However, the decrease in gas power and the lack of increase in hydropower and atomic energy reflect a potential need for diversification in the energy mix to ensure long-term sustainability and capacity growth. The reliance on thermal energy, while robust, may need balancing with investments in renewables or cleaner technologies.
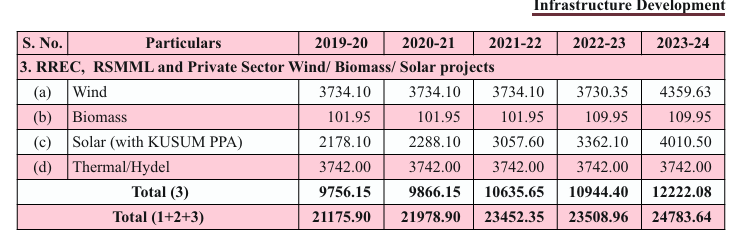
Table – Installed Capacity from Wind, Biomass, Solar, and Thermal/Hydel Projects
Analytical Summary
This table presents data on the installed capacity from wind, biomass, solar (with KUSUM PPA), and thermal/hydel projects for the years 2019-20 to 2023-24. The data is categorized based on the contributions from RREC (Rajasthan Renewable Energy Corporation Limited), RSMM (Rajasthan State Mines and Minerals), and private sector projects.
Key Data Points
- Wind Power:
- Installed capacity was stable at 3734.10 MW from 2019-20 to 2021-22, then slightly decreased in 2022-23 (3730.35 MW) before increasing significantly to 4359.63 MW in 2023-24.
- Biomass Power:
- Biomass capacity remained constant at 101.95 MW across all years except for a minor increase in 2022-23 and 2023-24, reaching 109.95 MW.
- Solar Power (with KUSUM PPA):
- Solar capacity showed consistent growth from 2178.10 MW in 2019-20 to 3057.60 MW in 2021-22. It further increased to 4010.50 MW in 2023-24.
- Thermal/Hydel Power:
- The installed capacity for thermal/hydel has remained constant at 3742.00 MW across all years.
- Total (3) (Cumulative Wind, Biomass, Solar, and Thermal/Hydel Projects):
- The total installed capacity increased steadily from 9756.15 MW in 2019-20 to 12222.08 MW in 2023-24.
- Total (1+2+3) (Including all forms of state-owned, central sector, and private projects):
- The total installed capacity grew from 21175.90 MW in 2019-20 to 24783.64 MW in 2023-24.
Key Observations
- Wind power capacity saw significant growth in 2023-24 after several years of stability, indicating a renewed focus on expanding wind energy resources.
- Solar power has experienced the most consistent growth, reflecting the increasing reliance on renewable energy and the effectiveness of the KUSUM PPA (Kisan Urja Suraksha evam Utthaan Mahabhiyan) initiative, which promotes decentralized solar power.
- Biomass power has shown little growth, with only a slight increase over the five years. This suggests that biomass may not be a primary focus of renewable energy development in the region.
- Thermal and hydel projects have maintained a consistent capacity, indicating no significant expansion or reduction in these areas.
Key Terms
- Wind Power: Energy generated by harnessing the power of wind through wind turbines.
- Biomass Power: Renewable energy produced by burning organic materials such as wood, agricultural residues, or waste.
- Solar Power (KUSUM PPA): Solar energy generated through projects under the KUSUM scheme, aimed at promoting the installation of solar pumps and plants in agricultural areas.
- Thermal/Hydel Power: Power generated using thermal energy (typically from fossil fuels) or hydropower (from water flow).
Key Insights
- The significant growth in solar power is a clear indicator that the state is investing heavily in renewable energy, particularly through initiatives like KUSUM PPA. This aligns with national and global trends toward sustainable energy sources.
- Wind power has seen a resurgence in 2023-24, which may suggest improvements in technology, infrastructure, or favorable policy support for wind energy projects.
- The stable contribution of thermal and hydel energy likely indicates that these are established, mature sources of energy in the state’s energy mix. However, there is no sign of expansion in these traditional energy sectors.
- Biomass energy’s limited growth suggests that it may not be seen as a scalable or primary energy solution for the state, possibly due to logistical challenges or lower efficiency compared to other renewable sources.
Conclusion
Rajasthan’s energy landscape is seeing a shift towards renewable sources, particularly solar and wind power, while thermal and hydel energy remain steady but unexpanded. The growth in solar energy is a critical driver for the state’s move toward a more sustainable energy infrastructure, supported by schemes like KUSUM PPA. Wind energy also shows potential for future growth, as seen in the 2023-24 expansion. Overall, the state is making commendable progress in diversifying its energy portfolio, with a clear emphasis on renewable energy solutions.
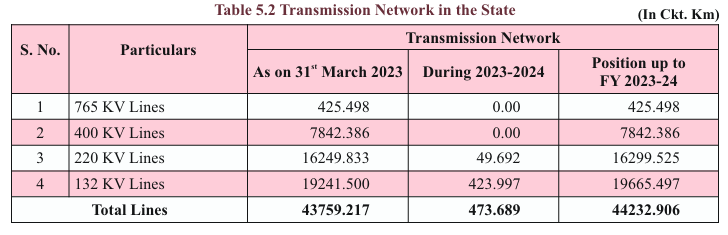
Table 5.2
Analytical Summary
This table details the transmission network infrastructure of Rajasthan, categorizing the data by different voltage levels of the transmission lines (765 kV, 400 kV, 220 kV, and 132 kV) as of March 31, 2023, along with expansions during the fiscal year 2023-2024. The total transmission network for each voltage level is recorded, highlighting both the network as it stood by the end of FY 2023 and the additions in FY 2023-2024.
Key Data Points
- 765 kV Lines:
- As of March 31, 2023, the length of 765 kV lines was 425.498 Ckt. Km, with no additions during 2023-24.
- 400 kV Lines:
- The 400 kV lines remained at 7842.386 Ckt. Km with no additional lines added in 2023-24.
- 220 kV Lines:
- The 220 kV transmission network was 16,249.833 Ckt. Km at the end of FY 2023, with an additional 49.692 Ckt. Km added during 2023-24, making the total 16,299.525 Ckt. Km.
- 132 kV Lines:
- This category showed significant expansion, with a total of 19,241.500 Ckt. Km as of March 2023, and 423.997 Ckt. Km added during FY 2023-24, reaching a total of 19,665.497 Ckt. Km.
- Total Transmission Lines:
- The total length of transmission lines in Rajasthan stood at 43,759.217 Ckt. Km at the end of FY 2023, with an additional 473.689 Ckt. Km added in 2023-24, culminating in a total transmission network of 44,232.906 Ckt. Km.
Key Observations
- Expansion in Lower Voltage Lines: The most significant expansion occurred in the 132 kV lines, with an increase of 423.997 Ckt. Km during 2023-24. This reflects an emphasis on enhancing medium-voltage transmission networks to support distribution at regional levels.
- Limited Growth in Higher Voltage Lines: The 765 kV and 400 kV lines saw no additional expansion during 2023-24. This suggests that the higher voltage transmission infrastructure is either sufficient for the state’s needs or that there is a strategic focus on maintaining the existing infrastructure for these lines.
- Moderate Expansion in 220 kV Lines: A moderate addition of 49.692 Ckt. Km was seen in the 220 kV lines, indicating a balanced approach to maintaining and expanding this part of the grid, which serves as an intermediary between high-voltage transmission and lower distribution networks.
Key Terms
- Transmission Network: The interconnected network of high-voltage power lines used to transport electricity from generation plants to distribution networks.
- Circuit Kilometer (Ckt. Km): A measurement of the length of a power line, representing the total length of all circuits (conductors) within a transmission line.
- kV (Kilovolt): A unit of electric potential equal to 1,000 volts, used to measure the voltage capacity of transmission lines.
Key Insights
- The significant focus on 132 kV lines indicates a priority for enhancing the local or regional distribution capacity, as this voltage level is typically used for transmitting electricity from substations to areas of consumption.
- The stagnant growth in 765 kV and 400 kV lines suggests that the bulk transmission infrastructure is either adequate or that expansion in this area is not currently prioritized due to other energy infrastructure developments (e.g., renewable energy projects).
- The steady expansion in the 220 kV line segment shows a balance in managing medium-to-high voltage infrastructure, which plays a crucial role in transmitting power across medium distances, often between major urban and industrial centers.
Conclusion
Rajasthan’s transmission network continues to grow, particularly at the 132 kV and 220 kV levels, signaling a focus on improving regional power distribution infrastructure. The higher-voltage 765 kV and 400 kV lines have remained stable, reflecting no current need for expansion. This suggests that the state’s strategy is centered on reinforcing local and medium-range power delivery to cater to increasing demand in those areas, likely influenced by the growth in industrial and urban electricity needs.
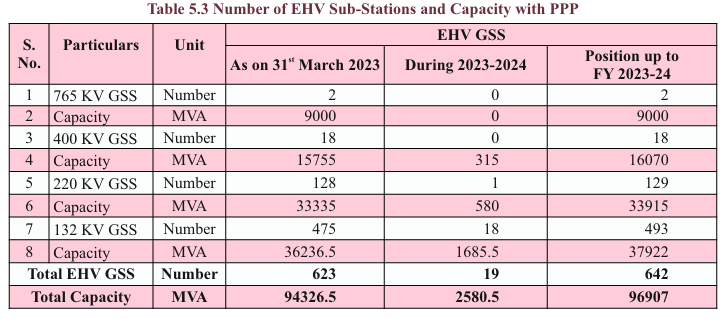
Table 5.3
Analytical Summary
This table provides detailed data on the number of Extra High Voltage (EHV) sub-stations in Rajasthan as of March 31, 2023, including new sub-stations added during the fiscal year 2023-24. It also outlines the capacity of these sub-stations, measured in MVA (Mega Volt-Amperes), a unit used to indicate the power capacity of the sub-stations.
Key Data Points
- 765 kV GSS (Grid Sub-Stations):
- Number of sub-stations as of March 2023: 2
- Capacity: 9000 MVA
- No new 765 kV sub-stations added in FY 2023-24.
- 400 kV GSS:
- Number of sub-stations as of March 2023: 18
- Capacity: 15,755 MVA, with 315 MVA added during FY 2023-24.
- Total capacity by FY 2023-24: 16,070 MVA.
- 220 kV GSS:
- Number of sub-stations as of March 2023: 128
- Capacity: 33,335 MVA, with 580 MVA added during FY 2023-24.
- Total number of 220 kV sub-stations by FY 2023-24: 129.
- Total capacity by FY 2023-24: 33,915 MVA.
- 132 kV GSS:
- Number of sub-stations as of March 2023: 475
- Capacity: 36,236.5 MVA, with 1,685.5 MVA added during FY 2023-24.
- Total number of 132 kV sub-stations by FY 2023-24: 493.
- Total capacity by FY 2023-24: 37,922 MVA.
- Total EHV GSS (including all voltage levels):
- Total number of sub-stations as of March 2023: 623, with 19 sub-stations added during FY 2023-24.
- Total number of sub-stations by FY 2023-24: 642.
- Total capacity as of March 2023: 94,326.5 MVA, with an additional 2,580.5 MVA added during FY 2023-24.
- Total capacity by FY 2023-24: 96,907 MVA.
Key Observations
- 132 kV sub-stations have seen the most growth: This category witnessed the largest expansion both in terms of the number of new sub-stations (18 added) and the highest capacity increase (1,685.5 MVA), highlighting the state’s focus on enhancing its regional power distribution infrastructure.
- No growth in the number of 765 kV sub-stations: The 765 kV sub-stations, which typically serve the highest voltage levels in the transmission network, remained constant at 2, indicating that the current infrastructure is sufficient for the state’s needs in this voltage category.
- Moderate growth in 220 kV and 400 kV sub-stations: The addition of 1 new sub-station at 220 kV and none at 400 kV indicates steady but cautious growth in the middle voltage levels of the grid, which play a critical role in connecting high-voltage transmission to regional distribution.
Key Terms
- GSS (Grid Sub-Station): A facility in the power transmission system that steps down high-voltage electricity from transmission lines to lower voltages suitable for distribution.
- MVA (Mega Volt-Amperes): A unit that measures the apparent power capacity of a sub-station, representing both active (useful) and reactive (non-useful) power.
- EHV (Extra High Voltage): Transmission lines and sub-stations operating at very high voltage levels (typically 132 kV and above) to transmit electricity over long distances with minimal loss.
Key Insights
- The substantial expansion in 132 kV sub-stations reflects Rajasthan’s focus on improving its regional distribution network, suggesting rising power demand in local areas.
- The steady capacity increases at 400 kV and 220 kV voltage levels indicate the state’s continued investment in middle-tier transmission infrastructure, which balances high-voltage transmission and lower voltage distribution.
- No new additions to 765 kV sub-stations suggest that the highest voltage infrastructure remains robust and adequate to meet current power transmission demands, without requiring further expansion.
Conclusion
Rajasthan’s power infrastructure has seen significant expansion, particularly at the 132 kV and 220 kV levels, to enhance power distribution across the state. The focus on expanding regional sub-stations aligns with growing local demand for electricity, while the stability in 765 kV and 400 kV infrastructure reflects that these higher voltage networks are already well-equipped to handle the state’s power needs. The overall increase in sub-station capacity by 2,580.5 MVA indicates Rajasthan’s strong commitment to modernizing and expanding its electrical grid to meet the demands of industrial growth, urbanization, and rural electrification.
Table 5.4
Analytical Summary
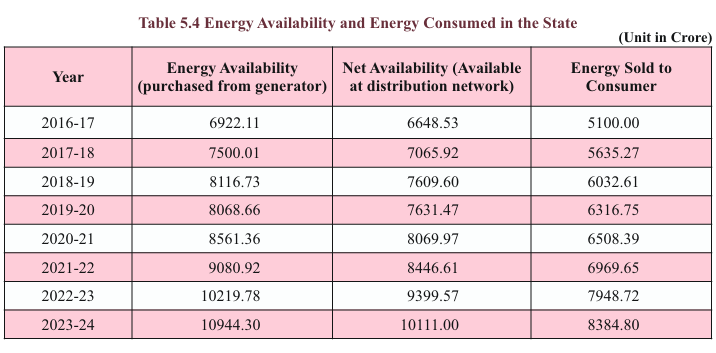
This table provides a year-wise breakdown of energy availability, net availability at the distribution network, and energy sold to consumers in Rajasthan from the fiscal year 2016-17 to 2023-24. The figures highlight the trends in energy generation, distribution, and consumption in the state.
Key Data Points
- Energy Availability (Purchased from Generator):
- 2016-17: 6922.11 crore units
- 2023-24: 10944.30 crore units
- Increase from 2016-17 to 2023-24: 4,022.19 crore units (~58% growth)
- Net Availability (Available at Distribution Network):
- 2016-17: 6648.53 crore units
- 2023-24: 10111.00 crore units
- Increase from 2016-17 to 2023-24: 3,462.47 crore units (~52% growth)
- Energy Sold to Consumer:
- 2016-17: 5100.00 crore units
- 2023-24: 8384.80 crore units
- Increase from 2016-17 to 2023-24: 3,284.80 crore units (~64% growth)
Key Observations
- Significant Increase in Energy Availability: There is a consistent rise in energy availability over the years, particularly from 6922.11 crore units in 2016-17 to 10944.30 crore units in 2023-24, reflecting the state’s growing energy generation capacity.
- Improvement in Distribution Efficiency: Net availability at the distribution network has grown steadily in line with energy availability, from 6648.53 crore units in 2016-17 to 10111.00 crore units in 2023-24, suggesting improved distribution mechanisms and reduced losses.
- Energy Sold to Consumers Shows Rapid Growth: The energy sold to consumers has increased by 64% over the period, indicating rising demand for electricity due to industrialization, urbanization, and possibly rural electrification efforts. This trend shows that energy consumption is growing faster than availability, highlighting potential stress points for future infrastructure requirements.
- Stable Growth During and After COVID-19: Despite the challenges posed by the COVID-19 pandemic in 2020-21, the energy sector showed resilience. Energy availability grew from 8561.36 crore units in 2020-21 to 10944.30 crore units in 2023-24, demonstrating recovery and growth in the post-pandemic period.
Key Terms
- Energy Availability (Purchased from Generator): This represents the total energy procured from generation units.
- Net Availability: The actual energy that reaches the distribution network after accounting for transmission and technical losses.
- Energy Sold to Consumer: The total amount of energy consumed by the end consumers, including industrial, commercial, and residential sectors.
Key Insights
- Capacity Growth: The increase in energy availability reflects ongoing investments in power generation infrastructure, including renewable energy projects and capacity expansion in existing plants.
- Energy Demand Surge: The rapid increase in energy sold to consumers (64% over 7 years) suggests that Rajasthan is experiencing a rise in electricity demand, driven by industrial growth, urban development, and expanding rural electrification.
- Infrastructure Stress: The gap between energy availability and energy sold suggests that, despite improvements, there are still distribution challenges, including technical losses and inefficiencies that need addressing to fully meet consumer demand.
- Future Planning: The increasing trend highlights the need for future investments in grid modernization, reducing technical losses, and enhancing renewable energy integration to ensure sustainable growth.
Conclusion
Rajasthan’s energy sector has seen impressive growth in terms of availability, distribution, and consumption over the past seven years. With a significant increase in energy sold to consumers, it is clear that the state’s power infrastructure is expanding to meet rising demand. However, continued investment in improving the distribution network and increasing energy generation capacity, especially through renewable sources, will be critical to maintaining this growth trajectory while ensuring reliability and efficiency.
Table 5.5
Analytical Summary
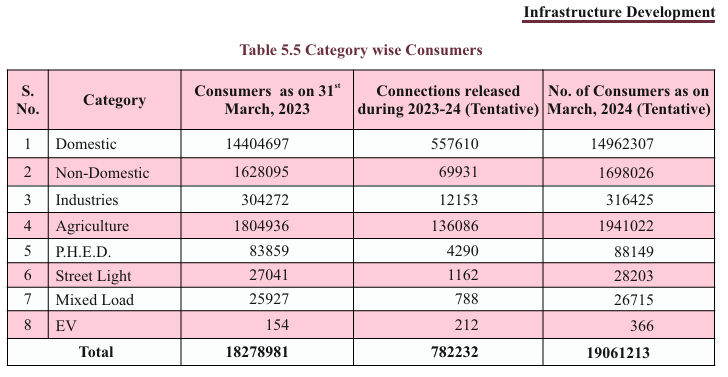
This table provides a detailed breakdown of various categories of electricity consumers in Rajasthan as of March 31, 2023, along with tentative data for new connections released during 2023-24 and the projected number of consumers as of March 2024.
Key Data Points
- Total Consumers as of March 31, 2023: 18,278,981
- Total Connections Released During 2023-24 (Tentative): 782,232
- Total Consumers Projected for March 2024: 19,061,213
Breakdown by Category
- Domestic Consumers:
- 2023: 14,404,697
- New Connections (2023-24): 557,610
- 2024 (Tentative): 14,962,307
- Non-Domestic Consumers:
- 2023: 1,628,095
- New Connections (2023-24): 69,931
- 2024 (Tentative): 1,698,026
- Industries:
- 2023: 304,272
- New Connections (2023-24): 12,153
- 2024 (Tentative): 316,425
- Agriculture:
- 2023: 1,804,936
- New Connections (2023-24): 136,086
- 2024 (Tentative): 1,941,022
- Public Health Engineering Department (P.H.E.D.):
- 2023: 83,859
- New Connections (2023-24): 4,290
- 2024 (Tentative): 88,149
- Street Lights:
- 2023: 27,041
- New Connections (2023-24): 1,162
- 2024 (Tentative): 28,203
- Mixed Load:
- 2023: 25,927
- New Connections (2023-24): 788
- 2024 (Tentative): 26,715
- Electric Vehicle (EV):
- 2023: 154
- New Connections (2023-24): 212
- 2024 (Tentative): 366
Key Observations
- Domestic Sector Dominates: Domestic consumers make up the largest share, comprising 14.4 million consumers in 2023 and projected to increase to 14.9 million in 2024, representing over 75% of the total connections.
- Growth in Agricultural Connections: Agriculture is another significant sector, with 1.80 million consumers in 2023, projected to increase to 1.94 million by 2024, reflecting efforts to provide power for irrigation and rural electrification.
- Increasing Adoption of Electric Vehicles (EVs): Although the absolute numbers for EV-related connections are still minimal, there is a notable rise in new EV connections (from 154 in 2023 to a projected 366 by 2024), indicating growth in electric vehicle adoption.
- Non-Domestic and Industrial Growth: Non-domestic (commercial) and industrial sectors also see steady increases, with 69,931 new non-domestic connections and 12,153 new industrial connections expected during 2023-24.
- Public Infrastructure: Public sectors like street lighting and public health engineering are seeing modest growth, particularly in street light connections.
Key Terms
- Domestic Consumers: Households or residential areas using electricity primarily for non-commercial purposes.
- Non-Domestic Consumers: Businesses and commercial entities excluding industrial users.
- Industries: Large-scale and small-scale manufacturing or production units.
- Agriculture: Consumers using electricity for farming purposes, primarily for irrigation.
- P.H.E.D. (Public Health Engineering Department): Public infrastructure for supplying water and sanitation services.
- Mixed Load: Areas where electricity is used for multiple purposes (both domestic and non-domestic uses).
- EV (Electric Vehicle): Connections specifically for electric vehicle charging stations or infrastructure.
Key Insights
- Rising Demand in Domestic and Agricultural Sectors: The largest growth in consumer numbers is expected in the domestic and agricultural sectors, suggesting increasing electrification in both urban and rural areas.
- Expanding EV Infrastructure: Although the numbers are currently small, the sharp increase in EV connections indicates a growing infrastructure for electric vehicles, aligning with government policies promoting electric mobility.
- Steady Industrial and Commercial Expansion: The non-domestic and industrial categories show moderate but steady growth, implying an expanding business and industrial base in the state.
Conclusion
The data reflects Rajasthan’s efforts in increasing electricity access across different consumer categories. With a focus on growing domestic and agricultural sectors, the state is also gradually building its infrastructure for commercial, industrial, and electric vehicle users. The expanding consumer base points to overall economic growth and an increasing demand for energy in various sectors, highlighting the need for continued investment in energy generation and distribution networks.
Table 5.6
Analytical Summary
This table provides a breakdown of the total road length in Rajasthan, categorized into five main road classifications. The data includes various types of roads based on their surface quality, such as Black Top (BT), Metal Road (MR), Gravelled Road (GR), and Fair Weather (FW) roads, measured in kilometers (KM).
Key Data Points
- Total Road Length (All Classifications):
- Black Top (BT): 245,218.89 km
- Metal Road (MR): 11,723.68 km
- Gravelled Road (GR): 33,828.51 km
- Fair Weather (FW): 11,039.78 km
- Grand Total: 301,810.86 km
- Road Classifications:
- National Highways: 10,789.72 km (BT: 10,366.41 km)
- State Highways: 17,348.60 km (BT: 17,290.50 km)
- Major District Roads: 14,172.65 km (BT: 13,871.78 km)
- Other District Roads: 67,952.30 km (BT: 53,295.32 km)
- Village Roads: 191,547.59 km (BT: 150,394.88 km)
Key Observations
- Black Top (BT) Roads Dominate: A significant portion of the road network, 245,218.89 km, is black-topped, meaning they are paved and offer all-weather connectivity. This reflects a strong infrastructure focus on long-lasting, high-quality roads.
- Village Roads: The highest contribution to road length comes from village roads, amounting to 191,547.59 km, of which a large portion (150,394.88 km) is Black Top. This indicates efforts to improve rural connectivity.
- National and State Highways: Combined, National and State Highways account for 28,138.32 km of the total road length, with the majority being black-topped, signifying the importance placed on high-quality, long-distance routes for efficient transportation.
- Gravelled Roads (GR): Significant gravelled roads exist in the network, totaling 33,828.51 km, indicating a substantial portion of the road network is still under development or requires upgrading to paved status.
- Fair Weather (FW) Roads: 11,039.78 km of roads are fair-weather only, meaning they may become difficult to traverse during adverse weather conditions such as rains, which highlights areas requiring further infrastructure development.
- Minor Contributions of Metal Roads (MR): Metal roads (usually lower quality than Black Top but better than Gravelled roads) contribute 11,723.68 km, mostly in other district and village roads.
Key Terms
- Black Top (BT): Roads with a bituminous surface, also known as paved roads. They offer the highest durability and all-weather usability.
- Metal Road (MR): Roads that have a surface of compacted crushed stone or metal. These are of lower quality than Black Top roads.
- Gravelled Road (GR): Roads made from gravel, offering a loose surface and are typically used in less trafficked areas.
- Fair Weather (FW): Roads that are usable only in good weather conditions and may become impassable in rainy or adverse weather.
Key Insights
- Rural Connectivity Focus: The vast network of village roads, especially the black-topped ones, points towards a strong focus on rural connectivity, ensuring that villages are connected year-round with durable roads.
- Urban and Inter-district Infrastructure: National and state highways, as well as major district roads, are largely paved with Black Top surfaces, emphasizing efficient transportation within and between cities and districts.
- Need for Upgrading Gravel and Fair Weather Roads: The large number of gravelled and fair-weather roads highlights the need for future infrastructure upgrades to improve year-round accessibility and road safety.
- Expansion Opportunities: Roads classified as gravel or fair-weather present opportunities for future expansion and upgrading, especially in remote and rural regions where development is still catching up.
Conclusion
The road infrastructure in Rajasthan is well-developed, with a majority of roads black-topped, particularly in the village, national, and state highway categories. However, the presence of a significant number of gravelled and fair-weather roads suggests that future development could focus on upgrading these roads to improve year-round access and durability. This road network supports both urban and rural development, contributing to economic growth and connectivity across the state.
Table 5.7
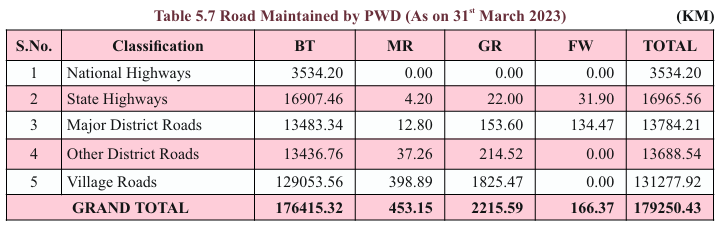
Analytical Summary
This table presents data on the road network maintained by the Public Works Department (PWD) in Rajasthan, broken down by road type and classification. The roads are categorized into Black Top (BT), Metal Road (MR), Gravelled Road (GR), and Fair Weather (FW), with totals given in kilometers (KM).
Key Data Points
- Total Road Length Maintained by PWD: 179,250.43 km
- Black Top (BT): 176,415.32 km
- Metal Road (MR): 453.15 km
- Gravelled Road (GR): 2,215.59 km
- Fair Weather (FW): 166.37 km
- Road Classifications:
- National Highways: 3,534.20 km (BT: 3,534.20 km)
- State Highways: 16,965.56 km (BT: 16,907.46 km)
- Major District Roads: 13,784.21 km (BT: 13,483.34 km)
- Other District Roads: 13,688.54 km (BT: 13,436.76 km)
- Village Roads: 131,277.92 km (BT: 129,053.56 km)
Key Observations
- Predominance of Black Top Roads: The majority of the PWD-maintained road network, approximately 176,415.32 km, consists of black-topped roads. This shows a strong emphasis on paved roads, which are essential for year-round connectivity and durability.
- Village Roads Dominate: Village roads form the largest portion of the PWD-maintained roads at 131,277.92 km, with 129,053.56 km of these roads black-topped. This highlights the focus on ensuring rural connectivity through high-quality, durable roads.
- Minimal Fair Weather and Metal Roads: Fair Weather (FW) roads only account for 166.37 km, and Metal Roads (MR) account for 453.15 km. This indicates that most roads are being paved to a higher standard.
- Gravel Roads: While a significant portion of the village and district roads remain gravelled (2,215.59 km), these roads may need to be prioritized for future upgrades to black-topped status.
- Well-Paved Highways: Both National Highways (3,534.20 km) and State Highways (16,965.56 km) under PWD maintenance are predominantly black-topped, ensuring smooth inter-district and national connectivity.
Key Terms
- Black Top (BT): Roads with a bituminous surface (asphalt-paved), offering high durability and weather resilience.
- Metal Road (MR): Roads surfaced with compacted crushed stone or metal, generally lower in quality than Black Top.
- Gravelled Road (GR): Roads surfaced with loose gravel, which are often found in less trafficked areas.
- Fair Weather (FW): Roads that can only be traversed in favorable weather conditions, often becoming unusable during rain or adverse weather.
Key Insights
- Focus on Durable Infrastructure: The PWD’s emphasis on maintaining a majority of roads as Black Top indicates a long-term investment in durable, all-weather road infrastructure. This is especially important for promoting economic activities and ensuring year-round accessibility across rural and urban areas.
- Rural Connectivity: The extensive network of village roads maintained by PWD is indicative of a strong focus on rural development. These roads play a crucial role in connecting rural areas to markets, healthcare, and educational facilities.
- Room for Upgradation: With over 2,215.59 km of roads still gravelled, particularly in district and village roads, there is room for upgradation to improve all-weather connectivity and reduce transportation challenges during adverse weather conditions.
- Minimal Fair Weather Roads: The low amount of fair-weather roads reflects the state’s progress toward eliminating roads that become impassable during the rainy season, further improving year-round transportation reliability.
Conclusion
The PWD in Rajasthan has made significant strides in maintaining a robust road network, with a majority of roads being Black Top, especially on national highways, state highways, and village roads. The department’s work reflects a strong commitment to enhancing road quality and ensuring year-round connectivity across the state, although there is still scope for upgrading gravelled and fair-weather roads to higher standards. The data highlights the continued development of road infrastructure as a backbone for economic growth, rural accessibility, and interstate connectivity.
Table 5.8
Analytical Summary
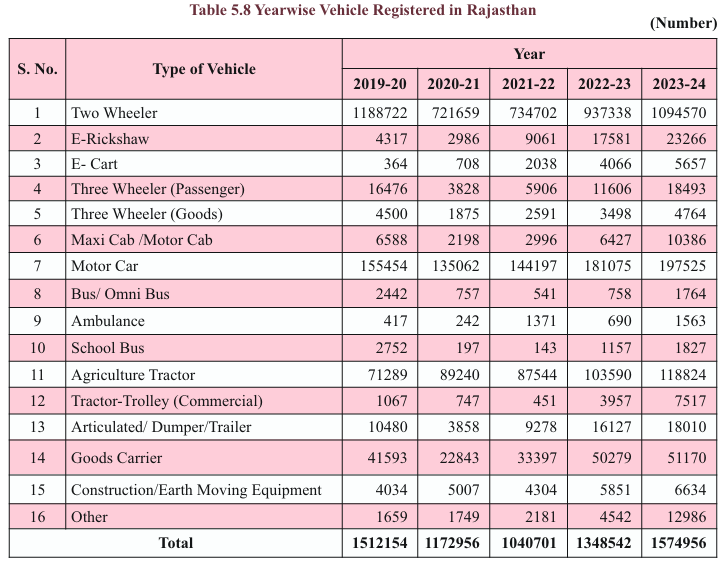
This table presents the yearwise registration data of various types of vehicles in Rajasthan from 2019-20 to 2023-24, showcasing trends in the growing number of registered vehicles over time.
Key Data Points
- Total Registrations: The total number of vehicle registrations has consistently increased from 1,512,154 in 2019-20 to 1,574,956 in 2023-24.
- Key Vehicle Types:
- Two-Wheeler: The largest segment, growing from 1,188,722 in 2019-20 to 1,094,570 in 2023-24.
- E-Rickshaw: A significant increase from 4,317 in 2019-20 to 23,266 in 2023-24, indicating a shift toward electric mobility.
- Motor Car: Growth from 155,454 in 2019-20 to 197,525 in 2023-24.
- Agriculture Tractor: Another notable growth from 71,289 in 2019-20 to 118,824 in 2023-24, reflecting increased mechanization in agriculture.
Key Observations
- Significant Growth in Two-Wheelers: Two-wheelers dominate the vehicle market, growing steadily from 1,188,722 in 2019-20 to 1,094,570 in 2023-24. The high number of two-wheeler registrations suggests the widespread use of these vehicles, likely due to affordability, ease of mobility, and preference in rural and urban areas.
- Rise in Electric Vehicles (E-Rickshaw and E-Cart): E-Rickshaws and E-Carts have shown a remarkable rise, especially E-Rickshaws, which jumped from 4,317 in 2019-20 to 23,266 in 2023-24. This indicates a clear shift towards sustainable, eco-friendly transportation, likely driven by government policies and incentives.
- Motor Car Registrations: There is a strong upward trend in motor car registrations, from 155,454 in 2019-20 to 197,525 in 2023-24. This reflects increasing affordability, rising incomes, and changing consumer preferences for personal mobility.
- Commercial and Agricultural Vehicle Growth:
-
- Agriculture Tractors saw an increase from 71,289 to 118,824 in the five-year span, highlighting the mechanization of agriculture.
- Goods Carrier registrations increased from 41,593 in 2019-20 to 51,170 in 2023-24, indicating growth in commercial transportation and logistics.
- Growth in Public and Utility Vehicles:
-
- Ambulances: Registrations more than tripled from 417 in 2019-20 to 1,563 in 2023-24, reflecting improved healthcare infrastructure.
- School Buses: The number of school buses increased, especially from 197 in 2020-21 to 1,827 in 2023-24, possibly due to a recovery post-pandemic.
Key Terms
- Two-Wheeler: Includes motorcycles and scooters, a popular mode of transport.
- E-Rickshaw: Electrically powered three-wheelers used for public transportation.
- E-Cart: Electrically powered small carts used for carrying goods.
- Agriculture Tractor: Tractors used primarily for agricultural purposes.
- Goods Carrier: Includes trucks and other vehicles used to transport goods.
- Maxi Cab / Motor Cab: Vehicles used for passenger transportation, often with a higher seating capacity.
- Articulated/Dumper/Trailer: Heavy vehicles used for transporting goods and materials, typically in construction and mining sectors.
Key Insights
- Shifting Towards Electrification: The rising number of E-Rickshaws and E-Carts signals an increasing adoption of electric vehicles (EVs) in the public and goods transport sectors. This is likely supported by policy measures aimed at reducing emissions and promoting sustainable mobility solutions.
- Expanding Rural Mechanization: The sharp increase in agriculture tractors reflects ongoing mechanization in the state’s farming sector, which is crucial for boosting productivity and efficiency.
- Increased Commercial Transportation: The steady rise in goods carriers and articulated vehicles indicates growing industrial and commercial activities, necessitating better logistical support and road infrastructure.
- Post-Pandemic Recovery: The growth in school buses and ambulances post-2021 reflects an improvement in essential services after the disruptions caused by COVID-19.
- Public Mobility Preferences: Two-wheelers and motor cars remain the preferred modes of transportation, with registrations showing consistent growth over the years. This points to rising middle-class prosperity and growing urbanization.
Conclusion
The yearwise vehicle registration data for Rajasthan reveals a clear trend of rising vehicle ownership and mobility across various sectors. The dominance of two-wheelers, coupled with the rise in electric vehicles and motor cars, reflects growing demand for personal transportation. At the same time, the increase in agriculture tractors, goods carriers, and commercial vehicles points to robust economic activities in agriculture and commerce. As the state continues to develop its infrastructure, especially post-pandemic, the demand for vehicles is likely to further accelerate.
Table 5.9
Analytical Summary
This table provides an overview of the year-wise vehicle fleet status for a set of corporation-owned and hired vehicles from 2019-20 to 2023-24, focusing on the fleet size, average fleet age, addition of new vehicles, and condemnation (removal) of old vehicles.
Key Data Points
- Total Fleet Size:
-
- 2019-20: 4,710
- 2020-21: 5,087 (increase)
- 2021-22: 4,326 (decrease)
- 2022-23: 3,983 (decrease)
- 2023-24: 3,665 (further decrease)
- Corporation vs. Hired Vehicles:
-
- Corporation Vehicles have reduced significantly from 3,751 in 2019-20 to 2,833 in 2023-24.
- Hired Vehicles have remained relatively stable, starting at 959 in 2019-20 and ending at 832 in 2023-24.
- Average Fleet Age: The fleet age has been increasing, from 00 years in 2019-20 to 7.90 years in 2023-24, reflecting a decline in the addition of new vehicles.
- New Vehicles Added to Fleet: The addition of new vehicles peaked at 534 in 2019-20 but has remained at 0 since 2021-22, indicating no further expansions in the fleet.
- Condemned Vehicles: The number of condemned (removed) vehicles started at 526 in 2019-20 and gradually decreased to 268 in 2023-24.
Key Observations
- Decreasing Fleet Size: The total number of vehicles has been steadily decreasing since the peak in 2020-21, indicating possible budget constraints, efficiency optimization, or a shift toward outsourcing through hired vehicles.
- Shift in Vehicle Ownership: There is a clear trend of reducing corporation-owned vehicles (dropping from 3,751 to 2,833), while hired vehicles have maintained a more stable presence. This suggests a potential shift towards more reliance on hired services rather than maintaining a large in-house fleet.
- Aging Fleet: The average age of the vehicle fleet has been consistently increasing, from 6 years in 2019-20 to nearly 8 years in 2023-24. This suggests that the fleet is not being updated or replaced with new vehicles, potentially leading to higher maintenance costs and less efficiency.
- No New Additions: No new vehicles have been added since 2021-22. This stagnation in fleet renewal points towards limited capital expenditure in vehicle procurement, which could be due to budgetary constraints or a strategic shift toward outsourcing.
- Reduced Condemnation: The rate of vehicle condemnation has also decreased, reflecting the aging nature of the fleet. Fewer older vehicles are being retired, which could strain operational efficiency.
Key Terms
- Corporation Vehicles: Vehicles owned and operated by the government or corporation.
- Hired Vehicles: Vehicles rented or hired from private sources for temporary use.
- Fleet Age: The average age of the vehicles in the fleet.
- Condemned Vehicles: Vehicles that have been deemed unfit for use and removed from the fleet.
Key Insights
- Strategic Shift to Outsourcing: The relatively stable number of hired vehicles, coupled with a declining number of corporation vehicles, suggests a move towards outsourcing or leasing vehicles rather than owning and maintaining them. This strategy could provide more flexibility in operations without incurring high capital costs.
- Aging Fleet May Lead to Higher Costs: The aging fleet, now approaching an average age of 8 years, may face increased maintenance costs, more frequent breakdowns, and reduced operational efficiency. This could pose challenges in maintaining reliable services in the long run.
- Budget Constraints or Policy Changes: The halt in new vehicle procurement since 2021-22 points to either financial constraints or a deliberate policy shift. If not addressed, this could lead to a growing burden on the aging fleet.
- Possible Sustainability Focus: The increasing age of vehicles and reduction in fleet size could also signal a shift toward more sustainable practices, such as relying on private service providers or focusing on electric and energy-efficient alternatives in the future.
Conclusion
The year-wise fleet data reveals a trend of downsizing the corporation’s vehicle fleet, an aging fleet, and a growing reliance on hired vehicles. The halt in new vehicle additions and declining vehicle condemnation rates could reflect budgetary or strategic shifts, but this may pose operational challenges in the long run due to an aging fleet. A comprehensive fleet renewal plan or increased outsourcing could address these issues and ensure the fleet remains effective and cost-efficient.
Table 5.10
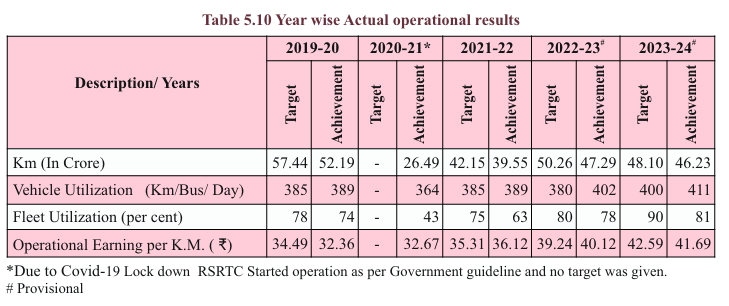
Analytical Summary
This table outlines the operational performance of the Rajasthan State Road Transport Corporation (RSRTC) across various metrics, including total kilometers traveled, vehicle utilization, fleet utilization, and operational earnings per kilometer for the years 2019-20 to 2023-24.
Key Data Points
- Kilometers Traveled (Km in crore):
- 2019-20: 52.19
- 2020-21: 26.49 (Sharp decline due to COVID-19 lockdown)
- 2021-22: 42.15
- 2022-23: 47.29
- 2023-24: 46.23 (Provisional)
- Vehicle Utilization (Km/Bus/Day):
- 2019-20: 389
- 2020-21: 364 (Reduction due to pandemic restrictions)
- 2021-22: 389
- 2022-23: 402
- 2023-24: 411 (Provisional)
- Fleet Utilization (Percentage):
- 2019-20: 74%
- 2020-21: 43% (Severely impacted by COVID-19)
- 2021-22: 75%
- 2022-23: 80%
- 2023-24: 81% (Provisional)
- Operational Earnings per Kilometer (₹):
- 2019-20: ₹32.36
- 2020-21: ₹32.67
- 2021-22: ₹35.31
- 2022-23: ₹40.12
- 2023-24: ₹41.69 (Provisional)
Key Observations
- COVID-19 Impact: The operational performance in 2020-21 was heavily affected by the COVID-19 lockdown, leading to a drastic reduction in kilometers traveled (down to 26.49 crore from 52.19 crore) and fleet utilization (from 74% to 43%).
- Post-COVID Recovery: The metrics show a consistent recovery post-pandemic. By 2022-23, kilometers traveled and fleet utilization returned to pre-pandemic levels, with operational earnings per kilometer reaching a high of ₹40.12.
- Increase in Vehicle Utilization: Vehicle utilization increased steadily from 364 Km/Bus/Day in 2020-21 to 411 Km/Bus/Day in 2023-24, showing improvements in efficiency and bus usage.
- Fleet Utilization Peaks: Fleet utilization peaked at 80% in 2022-23 and reached 81% in 2023-24, reflecting an increase in the active usage of the total available fleet.
- Growing Operational Earnings: Operational earnings per kilometer show a rising trend, increasing from ₹32.36 in 2019-20 to ₹41.69 in 2023-24. This indicates enhanced revenue generation per kilometer despite fluctuations in operational scale.
Key Terms
- Kilometers (Km): Total distance traveled by the entire fleet in a given year, measured in crores.
- Vehicle Utilization: Average kilometers a bus covers per day, indicating the intensity of bus usage.
- Fleet Utilization: The percentage of the total fleet actively in use, reflecting the operational efficiency.
- Operational Earnings per Kilometer: The revenue generated per kilometer, measuring profitability and cost management in operations.
Key Insights
- Resilient Recovery Post-COVID: RSRTC operations saw a significant impact during the 2020-21 period due to the COVID-19 pandemic, but the subsequent years reflect a robust recovery in terms of kilometers traveled, fleet utilization, and vehicle utilization.
- Operational Efficiency Gains: With the consistent rise in vehicle and fleet utilization from 2020-21 onward, the data indicates better fleet management, likely due to optimized route planning, increased demand for public transport, or enhanced maintenance.
- Rising Operational Earnings: The gradual increase in operational earnings per kilometer indicates improved cost management and revenue generation, a critical factor for RSRTC’s financial sustainability.
- Slight Decline in Kilometers Traveled in 2023-24: Despite the recovery in earnings and vehicle utilization, the total kilometers traveled in 2023-24 dropped slightly from 47.29 crore to 46.23 crore, which might reflect market saturation, logistical issues, or economic conditions affecting public transport usage.
Conclusion
The RSRTC has demonstrated significant resilience in recovering from the pandemic’s adverse effects, as shown by improvements in vehicle utilization, fleet deployment, and operational earnings. Although challenges remain in fully restoring the total kilometers traveled to pre-pandemic levels, operational efficiency gains and rising earnings per kilometer suggest a positive trajectory for RSRTC’s future performance. The data highlights the importance of maintaining high fleet utilization and continuing efforts to enhance operational earnings to ensure long-term sustainability.
Table 5.11
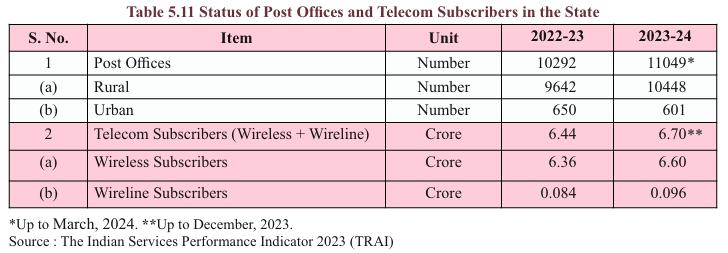
Analytical Summary
This table provides an overview of the total number of post offices and telecom subscribers (wireless and wireline) in the state for the years 2022-23 and 2023-24. It offers insights into the distribution of postal services between rural and urban areas and shows the growth in telecom subscribers during this period.
Key Data Points
- Post Offices:
- 2022-23: 10,292 total post offices.
- 2023-24: 11,049 total post offices (up to March 2024).
- Rural Post Offices:
- 2022-23: 9,642
- 2023-24: 10,448
- Urban Post Offices:
- 2022-23: 650
- 2023-24: 601
- Telecom Subscribers (Wireless + Wireline):
- 2022-23: 6.44 crore
- 2023-24: 6.70 crore (up to December 2023)
- Wireless Subscribers:
- 2022-23: 6.36 crore
- 2023-24: 6.60 crore
- Wireline Subscribers:
- 2022-23: 0.084 crore
- 2023-24: 0.096 crore
Key Observations
- Increase in Rural Post Offices: There is a notable increase in the number of rural post offices from 9,642 in 2022-23 to 10,448 in 2023-24. This indicates the expansion of postal services in rural areas.
- Decrease in Urban Post Offices: The number of urban post offices slightly decreased from 650 to 601 between 2022-23 and 2023-24, suggesting a shift in focus or consolidation of postal services in urban areas.
- Growth in Telecom Subscribers:
- The total number of telecom subscribers increased from 6.44 crore in 2022-23 to 6.70 crore in 2023-24.
- Wireless subscribers show a steady increase from 6.36 crore to 6.60 crore.
- Wireline subscribers also saw a marginal rise, though they account for a small proportion of the total telecom subscribers.
Key Terms
- Post Offices: These refer to the physical locations offering postal services to the public, categorized by rural and urban.
- Telecom Subscribers: Individuals or entities that are registered to use wireless or wireline telecommunication services.
- Wireless Subscribers: Subscribers using mobile or wireless communication services.
- Wireline Subscribers: Subscribers using traditional landline telephone services.
Key Insights
- Focus on Rural Expansion: The significant increase in the number of rural post offices indicates a continued emphasis on expanding postal services in less accessible areas, aligning with government initiatives to improve infrastructure in rural regions.
- Stability in Urban Postal Services: The slight decrease in urban post offices may reflect a strategic consolidation of services due to the higher reliance on digital communication in urban settings, reducing the need for as many physical postal outlets.
- Telecom Subscriber Growth: The increase in telecom subscribers, especially wireless, reflects the ongoing penetration of mobile and internet services across the state. This growth is likely driven by increased accessibility to mobile networks and affordable data plans.
- Wireline Subscribers Remain Niche: Wireline services remain a small segment of the telecom industry, with marginal growth. The increasing preference for wireless services, including broadband and mobile, may lead to the gradual phasing out of wireline services in the future.
Conclusion
The data highlights a clear focus on expanding rural infrastructure through an increase in rural post offices, while the telecom sector continues to experience steady growth, particularly in wireless services. The slight decline in urban post offices reflects changing communication dynamics, while the consistent rise in telecom subscribers indicates increased connectivity across the state.
Table 5.12
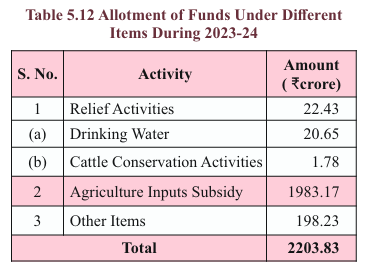
Analytical Summary
This table presents a detailed breakdown of funds allocated for various activities in the year 2023-24, highlighting the key areas of focus for resource distribution.
Key Data Points
- Relief Activities: ₹22.43 crore allocated.
-
- Drinking Water: ₹20.65 crore, a major component of relief activities.
- Cattle Conservation Activities: ₹1.78 crore allocated.
- Agriculture Inputs Subsidy: ₹1983.17 crore allocated, making it the largest share of the total funds.
- Other Items: ₹198.23 crore allocated for miscellaneous activities.
- Total Allocation: ₹2203.83 crore for all activities combined.
Key Observations
- Agriculture Inputs Subsidy Dominates: The largest share of funds, ₹1983.17 crore (around 90% of the total allocation), is directed towards agricultural inputs subsidy, reflecting the state’s emphasis on supporting the agriculture sector.
- Relief Activities Focus on Drinking Water: The majority of the funds for relief activities are allocated to drinking water projects (₹20.65 crore), underlining the importance of water management and supply, particularly in a state where water scarcity can be a significant issue.
- Minimal Allocation for Cattle Conservation: Only ₹1.78 crore is directed toward cattle conservation activities, indicating a smaller focus on livestock welfare compared to broader relief and agricultural subsidy efforts.
- Other Items: ₹198.23 crore is reserved for activities not specifically categorized, suggesting that additional miscellaneous or unforeseen expenses are anticipated.
Key Terms
- Relief Activities: Emergency or crisis-related activities, including water supply and cattle conservation efforts aimed at alleviating immediate hardships in the region.
- Agriculture Inputs Subsidy: Financial support provided to farmers for acquiring essential agricultural inputs such as seeds, fertilizers, and machinery to boost productivity and sustainability in the agriculture sector.
- Cattle Conservation Activities: Efforts aimed at preserving and maintaining the welfare of livestock, which are an essential part of rural economies, especially in regions dependent on animal husbandry.
- Miscellaneous Items: This category captures funds allocated for activities that do not fit into the other predefined categories, providing flexibility in the budget.
Key Insights
- Priority on Agriculture: With approximately 90% of the total funds allocated to agricultural inputs subsidy, it is clear that the state is focusing on strengthening its agricultural economy by supporting farmers in obtaining necessary inputs, improving productivity, and ensuring food security.
- Water Supply as a Key Relief Measure: The substantial allocation of ₹20.65 crore for drinking water projects emphasizes the importance of managing water resources in the state, particularly in rural and drought-prone areas.
- Small Proportion for Livestock: While cattle conservation is recognized as important, the relatively low allocation (₹1.78 crore) may indicate that other programs are in place for livestock welfare, or it may reflect the state’s current priorities in dealing with immediate challenges in other sectors.
- Balanced Miscellaneous Funds: A notable ₹198.23 crore allocated for “Other Items” ensures that the state has a buffer to address unexpected needs or projects not yet defined, allowing flexibility in fund usage.
Conclusion
The allotment of ₹2203.83 crore for 2023-24 reflects the state’s strong focus on agriculture, particularly through the provision of subsidies for agricultural inputs. The emphasis on drinking water within relief activities showcases the state’s ongoing efforts to address water scarcity. The allocation for miscellaneous items suggests a preparedness to manage unforeseen expenses or initiatives. Overall, the fund distribution aligns with key socio-economic priorities, particularly in strengthening agricultural resilience and water resource management.